Citibank 2014 Annual Report Download - page 181
Download and view the complete annual report
Please find page 181 of the 2014 Citibank annual report below. You can navigate through the pages in the report by either clicking on the pages listed below, or by using the keyword search tool below to find specific information within the annual report.-
 1
1 -
2
-
3
-
4
-
5
-
6
-
7
-
8
-
9
-
10
-
11
-
12
-
13
-
14
-
15
-
16
-
17
-
18
-
19
-
20
-
21
-
22
-
23
-
24
-
25
-
26
-
27
-
28
-
29
-
30
-
31
-
32
-
33
-
34
-
35
-
36
-
37
-
38
-
39
-
40
-
41
-
42
-
43
-
44
-
45
-
46
-
47
-
48
-
49
-
50
-
51
-
52
-
53
-
54
-
55
-
56
-
57
-
58
-
59
-
60
-
61
-
62
-
63
-
64
-
65
-
66
-
67
-
68
-
69
-
70
-
71
-
72
-
73
-
74
-
75
-
76
-
77
-
78
-
79
-
80
-
81
-
82
-
83
-
84
-
85
-
86
-
87
-
88
-
89
-
90
-
91
-
92
-
93
-
94
-
95
-
96
-
97
-
98
-
99
-
100
-
101
-
102
-
103
-
104
-
105
-
106
-
107
-
108
-
109
-
110
-
111
-
112
-
113
-
114
-
115
-
116
-
117
-
118
-
119
-
120
-
121
-
122
-
123
-
124
-
125
-
126
-
127
-
128
-
129
-
130
-
131
-
132
-
133
-
134
-
135
-
136
-
137
-
138
-
139
-
140
-
141
-
142
-
143
-
144
-
145
-
146
-
147
-
148
-
149
-
150
-
151
-
152
-
153
-
154
-
155
-
156
-
157
-
158
-
159
-
160
-
161
-
162
-
163
-
164
-
165
-
166
-
167
-
168
-
169
-
170
-
 171
171 -
 172
172 -
 173
173 -
 174
174 -
 175
175 -
 176
176 -
 177
177 -
 178
178 -
 179
179 -
 180
180 -
 181
181 -
 182
182 -
 183
183 -
 184
184 -
 185
185 -
 186
186 -
 187
187 -
 188
188 -
 189
189 -
 190
190 -
 191
191 -
192
-
193
-
194
-
195
-
196
-
197
-
198
-
199
-
200
-
201
-
202
-
203
-
204
-
205
-
206
-
207
-
208
-
209
-
210
-
211
-
212
-
213
-
214
-
215
-
216
-
217
-
218
-
219
-
220
-
221
-
222
-
223
-
224
-
225
-
226
-
227
-
228
-
229
-
230
-
231
-
232
-
233
-
234
-
235
-
236
-
237
-
238
-
239
-
240
-
241
-
242
-
243
-
244
-
245
-
246
-
247
-
248
-
249
-
250
-
251
-
252
-
253
-
254
-
255
-
256
-
257
-
258
-
259
-
260
-
261
-
262
-
263
-
264
-
265
-
266
-
267
-
268
-
269
-
270
-
271
-
272
-
273
-
274
-
275
-
276
-
277
-
278
-
279
-
280
-
281
-
282
-
283
-
284
-
285
-
286
-
287
-
288
-
289
-
290
-
291
-
292
-
293
-
294
-
295
-
296
-
297
-
298
-
299
-
300
-
301
-
302
-
303
-
304
-
305
-
306
-
307
-
308
-
309
-
310
-
311
-
312
-
313
-
314
-
315
-
316
-
317
-
318
-
319
-
320
-
321
-
322
-
323
-
324
-
325
-
326
-
327
 |
 |

164
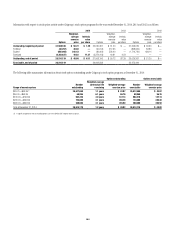
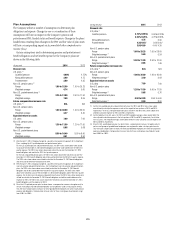
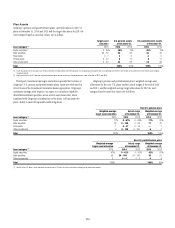
Information with respect to stock option activity under Citigroup’s stock option programs for the years ended December 31, 2014, 2013 and 2012 is as follows:
2014 2013 2012
Options
Weighted-
average
exercise
price
Intrinsic
value
per share Options
Weighted-
average
exercise
price
Intrinsic
value
per share Options
Weighted-
average
exercise
price
Intrinsic
value
per share
Outstanding, beginning of period 31,508,106 $ 50.72 $ 1.39 35,020,397 $ 51.20 $ — 37,596,029 $ 69.60 $—
Forfeited (28,257) 40.80 — (50,914) 212.35 — (858,906) 83.84 —
Expired (602,093) 242.43 — (86,964) 528.40 — (1,716,726) 438.14 —
Exercised (4,363,637) 40.82 11.37 (3,374,413) 40.81 9.54 — — —
Outstanding, end of period 26,514,119 $ 48.00 $ 6.11 31,508,106 $ 50.72 $1.39 35,020,397 $ 51.20 $—
Exercisable, end of period 26,514,119 30,662,588 32,973,444
The following table summarizes information about stock options outstanding under Citigroup’s stock option programs at December 31, 2014:
Options outstanding Options exercisable
Range of exercise prices
Number
outstanding
Weighted-average
contractual life
remaining
Weighted-average
exercise price
Number
exercisable
Weighted-average
exercise price
$29.70—$49.99 (1) 25,617,659 1.1 years $ 42.87 25,617,659 $ 42.87
$50.00—$99.99 69,956 6.1 years 56.76 69,956 56.76
$100.00—$199.99 502,416 4.0 years 147.13 502,416 147.13
$200.00—$299.99 124,088 3.1 years 240.28 124,088 240.28
$300.00—$399.99 200,000 3.1 years 335.50 200,000 335.50
Total at December 31, 2014 26,514,119 1.2 years $ 48.02 26,514,119 $ 48.02
(1) A significant portion of the outstanding options are in the $40 to $45 range of exercise prices.