Citibank 2014 Annual Report Download - page 228
Download and view the complete annual report
Please find page 228 of the 2014 Citibank annual report below. You can navigate through the pages in the report by either clicking on the pages listed below, or by using the keyword search tool below to find specific information within the annual report.-
 1
1 -
2
-
3
-
4
-
5
-
6
-
7
-
8
-
9
-
10
-
11
-
12
-
13
-
14
-
15
-
16
-
17
-
18
-
19
-
20
-
21
-
22
-
23
-
24
-
25
-
26
-
27
-
28
-
29
-
30
-
31
-
32
-
33
-
34
-
35
-
36
-
37
-
38
-
39
-
40
-
41
-
42
-
43
-
44
-
45
-
46
-
47
-
48
-
49
-
50
-
51
-
52
-
53
-
54
-
55
-
56
-
57
-
58
-
59
-
60
-
61
-
62
-
63
-
64
-
65
-
66
-
67
-
68
-
69
-
70
-
71
-
72
-
73
-
74
-
75
-
76
-
77
-
78
-
79
-
80
-
81
-
82
-
83
-
84
-
85
-
86
-
87
-
88
-
89
-
90
-
91
-
92
-
93
-
94
-
95
-
96
-
97
-
98
-
99
-
100
-
101
-
102
-
103
-
104
-
105
-
106
-
107
-
108
-
109
-
110
-
111
-
112
-
113
-
114
-
115
-
116
-
117
-
118
-
119
-
120
-
121
-
122
-
123
-
124
-
125
-
126
-
127
-
128
-
129
-
130
-
131
-
132
-
133
-
134
-
135
-
136
-
137
-
138
-
139
-
140
-
141
-
142
-
143
-
144
-
145
-
146
-
147
-
148
-
149
-
150
-
151
-
152
-
153
-
154
-
155
-
156
-
157
-
158
-
159
-
160
-
161
-
162
-
163
-
164
-
165
-
166
-
167
-
168
-
169
-
170
-
171
-
172
-
173
-
174
-
175
-
176
-
177
-
178
-
179
-
180
-
181
-
182
-
183
-
184
-
185
-
186
-
187
-
188
-
189
-
190
-
191
-
192
-
193
-
194
-
195
-
196
-
197
-
198
-
199
-
200
-
201
-
202
-
203
-
204
-
205
-
206
-
207
-
208
-
209
-
210
-
211
-
212
-
213
-
214
-
215
-
216
-
217
-
 218
218 -
 219
219 -
 220
220 -
 221
221 -
 222
222 -
 223
223 -
 224
224 -
 225
225 -
 226
226 -
 227
227 -
 228
228 -
 229
229 -
 230
230 -
 231
231 -
 232
232 -
 233
233 -
 234
234 -
 235
235 -
 236
236 -
 237
237 -
 238
238 -
239
-
240
-
241
-
242
-
243
-
244
-
245
-
246
-
247
-
248
-
249
-
250
-
251
-
252
-
253
-
254
-
255
-
256
-
257
-
258
-
259
-
260
-
261
-
262
-
263
-
264
-
265
-
266
-
267
-
268
-
269
-
270
-
271
-
272
-
273
-
274
-
275
-
276
-
277
-
278
-
279
-
280
-
281
-
282
-
283
-
284
-
285
-
286
-
287
-
288
-
289
-
290
-
291
-
292
-
293
-
294
-
295
-
296
-
297
-
298
-
299
-
300
-
301
-
302
-
303
-
304
-
305
-
306
-
307
-
308
-
309
-
310
-
311
-
312
-
313
-
314
-
315
-
316
-
317
-
318
-
319
-
320
-
321
-
322
-
323
-
324
-
325
-
326
-
327
 |
 |

211
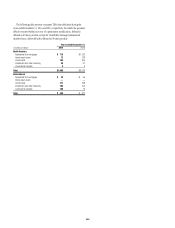
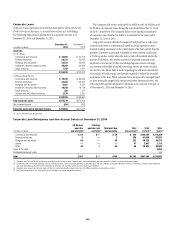
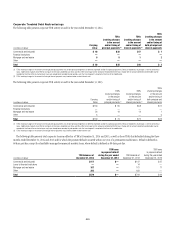
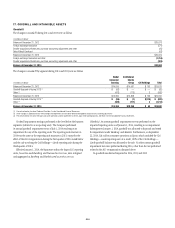
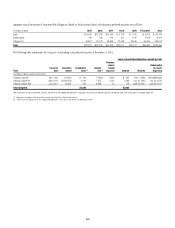
Purchased Distressed Loans
Included in the corporate and consumer loans outstanding tables above are
purchased distressed loans, which are loans that have evidenced significant
credit deterioration subsequent to origination but prior to acquisition by
Citigroup. In accordance with SOP 03-3 (codified as ASC 310-30), the
difference between the total expected cash flows for these loans and the
initial recorded investment is recognized in income over the life of the loans
using a level yield. Accordingly, these loans have been excluded from the
impaired loan table information presented above. In addition, per SOP 03-3,
subsequent decreases in the expected cash flows for a purchased distressed
loan require a build of an allowance so the loan retains its level yield.
However, increases in the expected cash flows are first recognized as a
reduction of any previously established allowance and then recognized as
income prospectively over the remaining life of the loan by increasing the
loan’s level yield. Where the expected cash flows cannot be reliably estimated,
the purchased distressed loan is accounted for under the cost recovery
method. The carrying amount of the Company’s purchased distressed
loan portfolio was $361 million and $590 million, net of an allowance of
$60 million and $113 million, at December 31, 2014 and 2013, respectively.
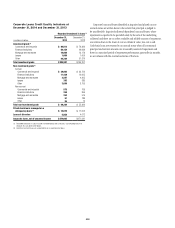
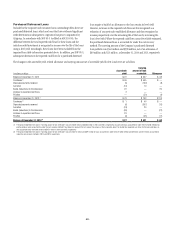
The changes in the accretable yield, related allowance and carrying amount net of accretable yield for 2014 and 2013 are as follows:
In millions of dollars
Accretable
yield
Carrying
amount of loan
receivable Allowance
Balance at December 31, 2012 $ 22 $ 537 $ 98
Purchases (1) $ 46 $ 405 $ —
Disposals/payments received (5) (199) (8)
Accretion (10) 10 —
Builds (reductions) to the allowance 22 — 25
Increase to expected cash flows 3 — —
FX/other — (50) (2)
Balance at December 31, 2013 (2) $ 78 $ 703 $113
Purchases (1) $ 1 $ 46 $ —
Disposals/payments received (6) (307) (15)
Accretion (24) 24 —
Builds (reductions) to the allowance (36) — (27)
Increase to expected cash flows 23 — —
FX/other (9) (45) (11)
Balance at December 31, 2014 (2) $ 27 $ 421 $ 60
(1) The balance reported in the column “Carrying amount of loan receivable” consists of $46 million and $405 million in 2014 and 2013, respectively, of purchased loans accounted for under the level-yield method. No
purchased loans were accounted for under the cost-recovery method. These balances represent the fair value of these loans at their acquisition date. The related total expected cash flows for the level-yield loans at
their acquisition dates were $46 million and $451 million in 2014 and 2013, respectively.
(2) The balance reported in the column “Carrying amount of loan receivable” consists of $413 million and $691 million of loans accounted for under the level-yield method and $8 million and $12 million accounted for
under the cost-recovery method in 2014 and 2013, respectively.