Citibank 2014 Annual Report Download - page 48
Download and view the complete annual report
Please find page 48 of the 2014 Citibank annual report below. You can navigate through the pages in the report by either clicking on the pages listed below, or by using the keyword search tool below to find specific information within the annual report.-
 1
1 -
2
-
3
-
4
-
5
-
6
-
7
-
8
-
9
-
10
-
11
-
12
-
13
-
14
-
15
-
16
-
17
-
18
-
19
-
20
-
21
-
22
-
23
-
24
-
25
-
26
-
27
-
28
-
29
-
30
-
31
-
32
-
33
-
34
-
35
-
36
-
37
-
 38
38 -
 39
39 -
 40
40 -
 41
41 -
 42
42 -
 43
43 -
 44
44 -
 45
45 -
 46
46 -
 47
47 -
 48
48 -
 49
49 -
 50
50 -
 51
51 -
 52
52 -
 53
53 -
 54
54 -
 55
55 -
 56
56 -
 57
57 -
 58
58 -
59
-
60
-
61
-
62
-
63
-
64
-
65
-
66
-
67
-
68
-
69
-
70
-
71
-
72
-
73
-
74
-
75
-
76
-
77
-
78
-
79
-
80
-
81
-
82
-
83
-
84
-
85
-
86
-
87
-
88
-
89
-
90
-
91
-
92
-
93
-
94
-
95
-
96
-
97
-
98
-
99
-
100
-
101
-
102
-
103
-
104
-
105
-
106
-
107
-
108
-
109
-
110
-
111
-
112
-
113
-
114
-
115
-
116
-
117
-
118
-
119
-
120
-
121
-
122
-
123
-
124
-
125
-
126
-
127
-
128
-
129
-
130
-
131
-
132
-
133
-
134
-
135
-
136
-
137
-
138
-
139
-
140
-
141
-
142
-
143
-
144
-
145
-
146
-
147
-
148
-
149
-
150
-
151
-
152
-
153
-
154
-
155
-
156
-
157
-
158
-
159
-
160
-
161
-
162
-
163
-
164
-
165
-
166
-
167
-
168
-
169
-
170
-
171
-
172
-
173
-
174
-
175
-
176
-
177
-
178
-
179
-
180
-
181
-
182
-
183
-
184
-
185
-
186
-
187
-
188
-
189
-
190
-
191
-
192
-
193
-
194
-
195
-
196
-
197
-
198
-
199
-
200
-
201
-
202
-
203
-
204
-
205
-
206
-
207
-
208
-
209
-
210
-
211
-
212
-
213
-
214
-
215
-
216
-
217
-
218
-
219
-
220
-
221
-
222
-
223
-
224
-
225
-
226
-
227
-
228
-
229
-
230
-
231
-
232
-
233
-
234
-
235
-
236
-
237
-
238
-
239
-
240
-
241
-
242
-
243
-
244
-
245
-
246
-
247
-
248
-
249
-
250
-
251
-
252
-
253
-
254
-
255
-
256
-
257
-
258
-
259
-
260
-
261
-
262
-
263
-
264
-
265
-
266
-
267
-
268
-
269
-
270
-
271
-
272
-
273
-
274
-
275
-
276
-
277
-
278
-
279
-
280
-
281
-
282
-
283
-
284
-
285
-
286
-
287
-
288
-
289
-
290
-
291
-
292
-
293
-
294
-
295
-
296
-
297
-
298
-
299
-
300
-
301
-
302
-
303
-
304
-
305
-
306
-
307
-
308
-
309
-
310
-
311
-
312
-
313
-
314
-
315
-
316
-
317
-
318
-
319
-
320
-
321
-
322
-
323
-
324
-
325
-
326
-
327
 |
 |

31
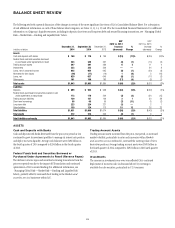
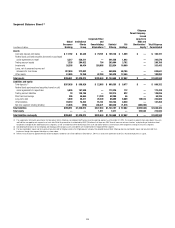
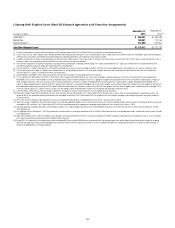
BALANCE SHEET REVIEW
The following sets forth a general discussion of the changes in certain of the more significant line items of Citi’s Consolidated Balance Sheet. For a description
of and additional information on each of these balance sheet categories, see Notes 11, 13, 14, 15 and 18 to the Consolidated Financial Statements. For additional
information on Citigroup’s liquidity resources, including its deposits, short-term and long-term debt and secured financing transactions, see “Managing Global
Risk—Market Risk—Funding and Liquidity Risk” below.
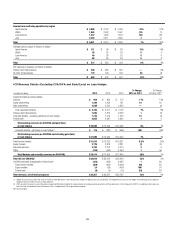
In billions of dollars
December 31,
2014
September 30,
2014
December 31,
2013
EOP
4Q14 vs. 3Q14
Increase
(decrease)
%
Change
EOP
4Q14 vs. 4Q13
Increase
(decrease)
%
Change
Assets
Cash and deposits with banks $ 160 $ 179 $ 199 $(19) (11)% $ (39) (20)%
Federal funds sold and securities borrowed
or purchased under agreements to resell 243 245 257 (2) (1) (14) (5)
Trading account assets 297 291 286 6 2 11 4
Investments 333 333 309 — — 24 8
Loans, net of unearned income 645 654 665 (9) (1) (20) (3)
Allowance for loan losses (16) (17) (19) 1 (6) 3 (16)
Loans, net 629 637 646 (8) (1) (17) (3)
Other assets 181 198 183 (17) (9) (2) (1)
Total assets $1,843 $1,883 $1,880 $(40) (2)% $ (37) (2)%
Liabilities
Deposits $ 899 $ 943 $ 968 $(44) (5)% $ (69) (7)%
Federal funds purchased and securities loaned or sold
under agreements to repurchase 173 176 204 (3) (2) (31) (15)
Trading account liabilities 139 137 109 2 1 30 28
Short-term borrowings 58 65 59 (7) (11) (1) (2)
Long-term debt 223 224 221 (1) — 2 1
Other liabilities 139 124 113 15 12 26 23
Total liabilities $1,631 $1,669 $1,674 $(38) (2)% $ (43) (3)%
Total equity 212 214 206 (2) (1) 6 3
Total liabilities and equity $1,843 $1,883 $1,880 $(40) (2)% $ (37) (2)%
ASSETS
Cash and Deposits with Banks
Cash and deposits with banks decreased from the prior-year period as Citi
continued to grow its investment portfolio to manage its interest rate position
and deploy its excess liquidity. Average cash balances were $182 billion in
the fourth quarter of 2014 compared to $204 billion in the fourth quarter
of 2013.
Federal Funds Sold and Securities Borrowed or
Purchased Under Agreements to Resell (Reverse Repos)
The decline in reverse repos and securities borrowing transactions from the
prior-year period was due to the impact of FX translation and continued
optimization of Citi’s secured lending (for additional information, see
“Managing Global Risk—Market Risk—Funding and Liquidity Risk”
below), partially offset by increased short trading in the Markets and
securities services businesses within ICG.
Trading Account Assets
Trading account assets increased from the prior-year period, as increased
market volatility, particularly in rates and currencies within Markets
and securities services within ICG, increased the carrying value of Citi’s
derivatives positions. Average trading account assets were $309 billion in
the fourth quarter of 2014 compared to $292 billion in the fourth quarter
of 2013.
Investments
The increase in investments year-over-year reflected Citi’s continued
deployment of its excess cash (as discussed above) by investing in
available-for-sale securities, particularly in U.S. treasuries.