Citibank 2014 Annual Report Download - page 213
Download and view the complete annual report
Please find page 213 of the 2014 Citibank annual report below. You can navigate through the pages in the report by either clicking on the pages listed below, or by using the keyword search tool below to find specific information within the annual report.-
 1
1 -
2
-
3
-
4
-
5
-
6
-
7
-
8
-
9
-
10
-
11
-
12
-
13
-
14
-
15
-
16
-
17
-
18
-
19
-
20
-
21
-
22
-
23
-
24
-
25
-
26
-
27
-
28
-
29
-
30
-
31
-
32
-
33
-
34
-
35
-
36
-
37
-
38
-
39
-
40
-
41
-
42
-
43
-
44
-
45
-
46
-
47
-
48
-
49
-
50
-
51
-
52
-
53
-
54
-
55
-
56
-
57
-
58
-
59
-
60
-
61
-
62
-
63
-
64
-
65
-
66
-
67
-
68
-
69
-
70
-
71
-
72
-
73
-
74
-
75
-
76
-
77
-
78
-
79
-
80
-
81
-
82
-
83
-
84
-
85
-
86
-
87
-
88
-
89
-
90
-
91
-
92
-
93
-
94
-
95
-
96
-
97
-
98
-
99
-
100
-
101
-
102
-
103
-
104
-
105
-
106
-
107
-
108
-
109
-
110
-
111
-
112
-
113
-
114
-
115
-
116
-
117
-
118
-
119
-
120
-
121
-
122
-
123
-
124
-
125
-
126
-
127
-
128
-
129
-
130
-
131
-
132
-
133
-
134
-
135
-
136
-
137
-
138
-
139
-
140
-
141
-
142
-
143
-
144
-
145
-
146
-
147
-
148
-
149
-
150
-
151
-
152
-
153
-
154
-
155
-
156
-
157
-
158
-
159
-
160
-
161
-
162
-
163
-
164
-
165
-
166
-
167
-
168
-
169
-
170
-
171
-
172
-
173
-
174
-
175
-
176
-
177
-
178
-
179
-
180
-
181
-
182
-
183
-
184
-
185
-
186
-
187
-
188
-
189
-
190
-
191
-
192
-
193
-
194
-
195
-
196
-
197
-
198
-
199
-
200
-
201
-
202
-
 203
203 -
 204
204 -
 205
205 -
 206
206 -
 207
207 -
 208
208 -
 209
209 -
 210
210 -
 211
211 -
 212
212 -
 213
213 -
 214
214 -
 215
215 -
 216
216 -
 217
217 -
 218
218 -
 219
219 -
 220
220 -
 221
221 -
 222
222 -
 223
223 -
224
-
225
-
226
-
227
-
228
-
229
-
230
-
231
-
232
-
233
-
234
-
235
-
236
-
237
-
238
-
239
-
240
-
241
-
242
-
243
-
244
-
245
-
246
-
247
-
248
-
249
-
250
-
251
-
252
-
253
-
254
-
255
-
256
-
257
-
258
-
259
-
260
-
261
-
262
-
263
-
264
-
265
-
266
-
267
-
268
-
269
-
270
-
271
-
272
-
273
-
274
-
275
-
276
-
277
-
278
-
279
-
280
-
281
-
282
-
283
-
284
-
285
-
286
-
287
-
288
-
289
-
290
-
291
-
292
-
293
-
294
-
295
-
296
-
297
-
298
-
299
-
300
-
301
-
302
-
303
-
304
-
305
-
306
-
307
-
308
-
309
-
310
-
311
-
312
-
313
-
314
-
315
-
316
-
317
-
318
-
319
-
320
-
321
-
322
-
323
-
324
-
325
-
326
-
327
 |
 |

196
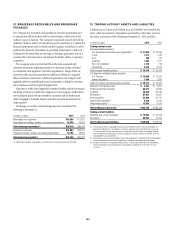
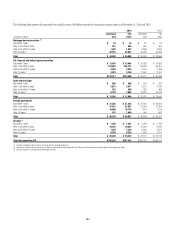
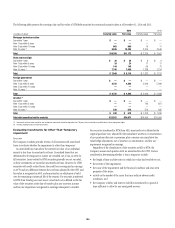
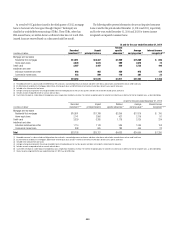
The following table presents the carrying value and fair value of HTM debt securities by contractual maturity dates as of December 31, 2014 and 2013:
2014 2013
In millions of dollars Carrying value Fair value Carrying value Fair value
Mortgage-backed securities
Due within 1 year $ — $ — $ — $ —
After 1 but within 5 years — — — —
After 5 but within 10 years 863 869 10 11
After 10 years (1) 9,846 10,303 2,316 2,546
Total $10,709 $11,172 $ 2,326 $ 2,557
State and municipal
Due within 1 year $ 36 $ 38 $ 8 $ 9
After 1 but within 5 years 24 24 17 17
After 5 but within 10 years 144 148 69 72
After 10 years (1) 7,745 7,909 1,238 1,214
Total $ 7,949 $ 8,119 $ 1,332 $ 1,312
Foreign government
Due within 1 year $ — $ — $ — $ —
After 1 but within 5 years 4,725 4,802 5,628 5,688
After 5 but within 10 years — — — —
After 10 years (1) — — — —
Total $ 4,725 $ 4,802 $ 5,628 $ 5,688
All other (2)
Due within 1 year $ — $ — $ — $ —
After 1 but within 5 years — — 740 851
After 5 but within 10 years — — — —
After 10 years (1) 538 578 573 585
Total $ 538 $ 578 $ 1,313 $ 1,436
Total debt securities held-to-maturity $23,921 $24,671 $10,599 $10,993
(1) Investments with no stated maturities are included as contractual maturities of greater than 10 years. Actual maturities may differ due to call or prepayment rights.
(2) Includes corporate and asset-backed securities.
Evaluating Investments for Other-Than-Temporary
Impairment
Overview
The Company conducts periodic reviews of all securities with unrealized
losses to evaluate whether the impairment is other-than-temporary.
An unrealized loss exists when the current fair value of an individual
security is less than its amortized cost basis. Unrealized losses that are
determined to be temporary in nature are recorded, net of tax, in AOCI for
AFS securities. Losses related to HTM securities generally are not recorded,
as these investments are carried at amortized cost basis. However, for HTM
securities with credit-related losses, the credit loss is recognized in earnings
as OTTI and any difference between the cost basis adjusted for the OTTI and
fair value is recognized in AOCI and amortized as an adjustment of yield
over the remaining contractual life of the security. For securities transferred
to HTM from Trading account assets, amortized cost is defined as the fair
value of the securities at the date of transfer, plus any accretion income
and less any impairment recognized in earnings subsequent to transfer.
For securities transferred to HTM from AFS, amortized cost is defined as the
original purchase cost, adjusted for the cumulative accretion or amortization
of any purchase discount or premium, plus or minus any cumulative fair
value hedge adjustments, net of accretion or amortization, and less any
impairment recognized in earnings.
Regardless of the classification of the securities as AFS or HTM, the
Company assesses each position with an unrealized loss for OTTI. Factors
considered in determining whether a loss is temporary include:
• the length of time and the extent to which fair value has been below cost;
• the severity of the impairment;
• the cause of the impairment and the financial condition and near-term
prospects of the issuer;
• activity in the market of the issuer that may indicate adverse credit
conditions; and
• the Company’s ability and intent to hold the investment for a period of
time sufficient to allow for any anticipated recovery.