Citibank 2014 Annual Report Download - page 28
Download and view the complete annual report
Please find page 28 of the 2014 Citibank annual report below. You can navigate through the pages in the report by either clicking on the pages listed below, or by using the keyword search tool below to find specific information within the annual report.-
 1
1 -
2
-
3
-
4
-
5
-
6
-
7
-
8
-
9
-
10
-
11
-
12
-
13
-
14
-
15
-
16
-
17
-
 18
18 -
 19
19 -
 20
20 -
 21
21 -
 22
22 -
 23
23 -
 24
24 -
 25
25 -
 26
26 -
 27
27 -
 28
28 -
 29
29 -
 30
30 -
 31
31 -
 32
32 -
 33
33 -
 34
34 -
 35
35 -
 36
36 -
 37
37 -
 38
38 -
39
-
40
-
41
-
42
-
43
-
44
-
45
-
46
-
47
-
48
-
49
-
50
-
51
-
52
-
53
-
54
-
55
-
56
-
57
-
58
-
59
-
60
-
61
-
62
-
63
-
64
-
65
-
66
-
67
-
68
-
69
-
70
-
71
-
72
-
73
-
74
-
75
-
76
-
77
-
78
-
79
-
80
-
81
-
82
-
83
-
84
-
85
-
86
-
87
-
88
-
89
-
90
-
91
-
92
-
93
-
94
-
95
-
96
-
97
-
98
-
99
-
100
-
101
-
102
-
103
-
104
-
105
-
106
-
107
-
108
-
109
-
110
-
111
-
112
-
113
-
114
-
115
-
116
-
117
-
118
-
119
-
120
-
121
-
122
-
123
-
124
-
125
-
126
-
127
-
128
-
129
-
130
-
131
-
132
-
133
-
134
-
135
-
136
-
137
-
138
-
139
-
140
-
141
-
142
-
143
-
144
-
145
-
146
-
147
-
148
-
149
-
150
-
151
-
152
-
153
-
154
-
155
-
156
-
157
-
158
-
159
-
160
-
161
-
162
-
163
-
164
-
165
-
166
-
167
-
168
-
169
-
170
-
171
-
172
-
173
-
174
-
175
-
176
-
177
-
178
-
179
-
180
-
181
-
182
-
183
-
184
-
185
-
186
-
187
-
188
-
189
-
190
-
191
-
192
-
193
-
194
-
195
-
196
-
197
-
198
-
199
-
200
-
201
-
202
-
203
-
204
-
205
-
206
-
207
-
208
-
209
-
210
-
211
-
212
-
213
-
214
-
215
-
216
-
217
-
218
-
219
-
220
-
221
-
222
-
223
-
224
-
225
-
226
-
227
-
228
-
229
-
230
-
231
-
232
-
233
-
234
-
235
-
236
-
237
-
238
-
239
-
240
-
241
-
242
-
243
-
244
-
245
-
246
-
247
-
248
-
249
-
250
-
251
-
252
-
253
-
254
-
255
-
256
-
257
-
258
-
259
-
260
-
261
-
262
-
263
-
264
-
265
-
266
-
267
-
268
-
269
-
270
-
271
-
272
-
273
-
274
-
275
-
276
-
277
-
278
-
279
-
280
-
281
-
282
-
283
-
284
-
285
-
286
-
287
-
288
-
289
-
290
-
291
-
292
-
293
-
294
-
295
-
296
-
297
-
298
-
299
-
300
-
301
-
302
-
303
-
304
-
305
-
306
-
307
-
308
-
309
-
310
-
311
-
312
-
313
-
314
-
315
-
316
-
317
-
318
-
319
-
320
-
321
-
322
-
323
-
324
-
325
-
326
-
327
 |
 |

11
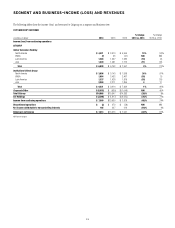
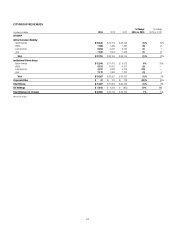
SEGMENT AND BUSINESS—INCOME (LOSS) AND REVENUES
The following tables show the income (loss) and revenues for Citigroup on a segment and business view:
CITIGROUP INCOME
In millions of dollars 2014 2013 2012
% Change
2014 vs. 2013
% Change
2013 vs. 2012
Income (loss) from continuing operations
CITICORP
Global Consumer Banking
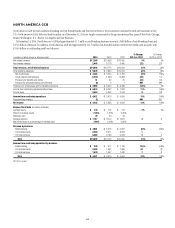
North America $ 4,421 $ 3,910 $ 4,564 13% (14)%
EMEA (7) 35 (61) NM NM
Latin America 1,204 1,337 1,382 (10) (3)
Asia 1,320 1,481 1,712 (11) (13)
Total $ 6,938 $ 6,763 $ 7,597 3% (11)%
Institutional Clients Group
North America $ 3,896 $ 3,143 $ 1,598 24% 97%
EMEA 1,984 2,432 2,467 (18) (1)
Latin America 1,337 1,628 1,879 (18) (13)
Asia 2,304 2,211 1,890 417
Total $ 9,521 $ 9,414 $ 7,834 1% 20%
Corporate/Other $ (5,593) $ (630) $ (1,048) NM 40%
Total Citicorp $10,866 $15,547 $14,383 (30)% 8%
Citi Holdings $ (3,366) $ (1,917) $ (6,565) (76)% 71%
Income from continuing operations $ 7,500 $13,630 $ 7,818 (45)% 74%
Discontinued operations $ (2) $ 270 $ (58) NM NM
Net income attributable to noncontrolling interests 185 227 219 (19)% 4%
Citigroup’s net income $ 7,313 $13,673 $ 7,541 (47)% 81%
NM Not meaningful