Citibank 2014 Annual Report Download - page 103
Download and view the complete annual report
Please find page 103 of the 2014 Citibank annual report below. You can navigate through the pages in the report by either clicking on the pages listed below, or by using the keyword search tool below to find specific information within the annual report.-
 1
1 -
2
-
3
-
4
-
5
-
6
-
7
-
8
-
9
-
10
-
11
-
12
-
13
-
14
-
15
-
16
-
17
-
18
-
19
-
20
-
21
-
22
-
23
-
24
-
25
-
26
-
27
-
28
-
29
-
30
-
31
-
32
-
33
-
34
-
35
-
36
-
37
-
38
-
39
-
40
-
41
-
42
-
43
-
44
-
45
-
46
-
47
-
48
-
49
-
50
-
51
-
52
-
53
-
54
-
55
-
56
-
57
-
58
-
59
-
60
-
61
-
62
-
63
-
64
-
65
-
66
-
67
-
68
-
69
-
70
-
71
-
72
-
73
-
74
-
75
-
76
-
77
-
78
-
79
-
80
-
81
-
82
-
83
-
84
-
85
-
86
-
87
-
88
-
89
-
90
-
91
-
92
-
 93
93 -
 94
94 -
 95
95 -
 96
96 -
 97
97 -
 98
98 -
 99
99 -
 100
100 -
 101
101 -
 102
102 -
 103
103 -
 104
104 -
 105
105 -
 106
106 -
 107
107 -
 108
108 -
 109
109 -
 110
110 -
 111
111 -
 112
112 -
 113
113 -
114
-
115
-
116
-
117
-
118
-
119
-
120
-
121
-
122
-
123
-
124
-
125
-
126
-
127
-
128
-
129
-
130
-
131
-
132
-
133
-
134
-
135
-
136
-
137
-
138
-
139
-
140
-
141
-
142
-
143
-
144
-
145
-
146
-
147
-
148
-
149
-
150
-
151
-
152
-
153
-
154
-
155
-
156
-
157
-
158
-
159
-
160
-
161
-
162
-
163
-
164
-
165
-
166
-
167
-
168
-
169
-
170
-
171
-
172
-
173
-
174
-
175
-
176
-
177
-
178
-
179
-
180
-
181
-
182
-
183
-
184
-
185
-
186
-
187
-
188
-
189
-
190
-
191
-
192
-
193
-
194
-
195
-
196
-
197
-
198
-
199
-
200
-
201
-
202
-
203
-
204
-
205
-
206
-
207
-
208
-
209
-
210
-
211
-
212
-
213
-
214
-
215
-
216
-
217
-
218
-
219
-
220
-
221
-
222
-
223
-
224
-
225
-
226
-
227
-
228
-
229
-
230
-
231
-
232
-
233
-
234
-
235
-
236
-
237
-
238
-
239
-
240
-
241
-
242
-
243
-
244
-
245
-
246
-
247
-
248
-
249
-
250
-
251
-
252
-
253
-
254
-
255
-
256
-
257
-
258
-
259
-
260
-
261
-
262
-
263
-
264
-
265
-
266
-
267
-
268
-
269
-
270
-
271
-
272
-
273
-
274
-
275
-
276
-
277
-
278
-
279
-
280
-
281
-
282
-
283
-
284
-
285
-
286
-
287
-
288
-
289
-
290
-
291
-
292
-
293
-
294
-
295
-
296
-
297
-
298
-
299
-
300
-
301
-
302
-
303
-
304
-
305
-
306
-
307
-
308
-
309
-
310
-
311
-
312
-
313
-
314
-
315
-
316
-
317
-
318
-
319
-
320
-
321
-
322
-
323
-
324
-
325
-
326
-
327
 |
 |

86
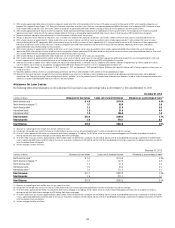
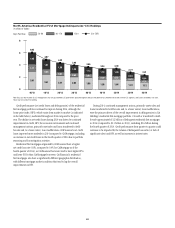
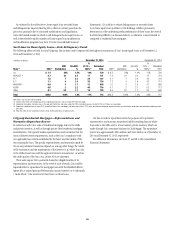
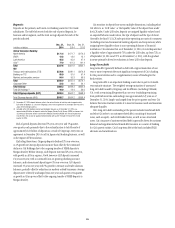
As evidenced by the tables above, home equity loan net credit losses
and delinquencies improved during 2014, albeit at a slower pace than the
prior year, primarily due to continued modifications and liquidations.
Given the limited market in which to sell delinquent home equity loans, as
well as the relatively smaller number of home equity loan modifications
and modification programs (see Note 15 to the Consolidated Financial
Statements), Citi’s ability to reduce delinquencies or net credit losses
in its home equity loan portfolio in Citi Holdings, whether pursuant to
deterioration of the underlying credit performance of these loans, the reset of
the Revolving HELOCs (as discussed above) or otherwise, is more limited as
compared to residential first mortgages.
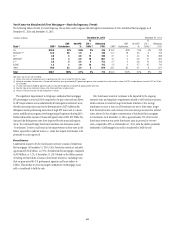
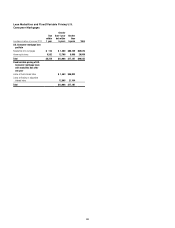
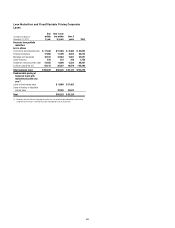
North America Home Equity Loans—State Delinquency Trends
The following tables set forth, for total Citigroup, the six states and/or regions with the highest concentration of Citi’s home equity loans as of December 31,
2014 and December 31, 2013.
In billions of dollars December 31, 2014 December 31, 2013
State (1) ENR (2)
ENR
Distribution
90+DPD
%
%
CLTV >
100% (3)
Refreshed
FICO ENR (2)
ENR
Distribution
90+DPD
%
%
CLTV >
100% (3)
Refreshed
FICO
CA $ 7.4 28% 1.5% 10% 729 $ 8.2 28% 1.6% 17% 726
NY/NJ/CT (4) 6.7 25 2.4 11 721 7.2 24 2.3 12 718
FL (4) 1.8 7 2.2 36 707 2.1 7 2.9 44 704
IL (4) 1.1 4 1.4 35 716 1.2 4 1.6 42 713
IN/OH/MI (4) 0.8 3 1.7 31 688 1.0 3 1.6 47 686
AZ/NV 0.6 2 2.2 46 716 0.7 2 2.1 53 713
Other 8.1 30 1.7 19 703 9.5 32 1.7 26 699
Total $26.6 100% 1.8% 17% 715 $29.9 100% 1.9% 23% 712
Note: Totals may not sum due to rounding.
(1) Certain of the states are included as part of a region based on Citi’s view of similar HPI within the region.
(2) Ending net receivables. Excludes loans in Canada and Puerto Rico and loans subject to LTSCs. Excludes balances for which FICO or LTV data are unavailable.
(3) Represents combined loan-to-value (CLTV) for both residential first mortgages and home equity loans. CLTV ratios (loan balance divided by appraised value) are calculated at origination and updated by applying market
price data.
(4) New York, New Jersey, Connecticut, Indiana, Ohio, Florida and Illinois are judicial states.
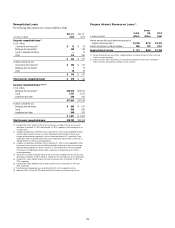
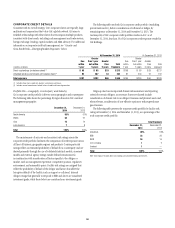
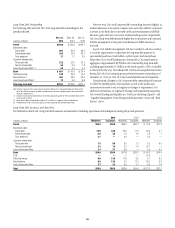
Citigroup Residential Mortgages—Representations and
Warranties Repurchase Reserve
In connection with Citi’s sales of residential mortgage loans to the GSEs
and private investors, as well as through private-label residential mortgage
securitizations, Citi typically makes representations and warranties that the
loans sold meet certain requirements, such as the loan’s compliance with
any applicable loan criteria established by the buyer and the validity of the
lien securing the loan. The specific representations and warranties made by
Citi in any particular transaction depend on, among other things, the nature
of the transaction and the requirements of the investor (e.g., whole loan sale
to the GSEs versus loans sold through securitization transactions), as well as
the credit quality of the loan (e.g., prime, Alt-A or subprime).
These sales expose Citi to potential claims for alleged breaches of its
representations and warranties. In the event of such a breach, Citi could be
required either to repurchase the mortgage loans with the identified defects
(generally at unpaid principal balance plus accrued interest) or to indemnify
(“make whole”) the investors for their losses on these loans.
Citi has recorded a repurchase reserve for purposes of its potential
representation and warranty repurchase liability resulting from its whole
loan sales to the GSEs and, to a lesser extent, private investors, which are
made through Citi’s consumer business in CitiMortgage. The repurchase
reserve was approximately $224 million and $341 million as of December 31,
2014 and December 31, 2013, respectively.
For additional information, see Notes 27 and 28 to the Consolidated
Financial Statements.