Citibank 2014 Annual Report Download - page 252
Download and view the complete annual report
Please find page 252 of the 2014 Citibank annual report below. You can navigate through the pages in the report by either clicking on the pages listed below, or by using the keyword search tool below to find specific information within the annual report.-
 1
1 -
2
-
3
-
4
-
5
-
6
-
7
-
8
-
9
-
10
-
11
-
12
-
13
-
14
-
15
-
16
-
17
-
18
-
19
-
20
-
21
-
22
-
23
-
24
-
25
-
26
-
27
-
28
-
29
-
30
-
31
-
32
-
33
-
34
-
35
-
36
-
37
-
38
-
39
-
40
-
41
-
42
-
43
-
44
-
45
-
46
-
47
-
48
-
49
-
50
-
51
-
52
-
53
-
54
-
55
-
56
-
57
-
58
-
59
-
60
-
61
-
62
-
63
-
64
-
65
-
66
-
67
-
68
-
69
-
70
-
71
-
72
-
73
-
74
-
75
-
76
-
77
-
78
-
79
-
80
-
81
-
82
-
83
-
84
-
85
-
86
-
87
-
88
-
89
-
90
-
91
-
92
-
93
-
94
-
95
-
96
-
97
-
98
-
99
-
100
-
101
-
102
-
103
-
104
-
105
-
106
-
107
-
108
-
109
-
110
-
111
-
112
-
113
-
114
-
115
-
116
-
117
-
118
-
119
-
120
-
121
-
122
-
123
-
124
-
125
-
126
-
127
-
128
-
129
-
130
-
131
-
132
-
133
-
134
-
135
-
136
-
137
-
138
-
139
-
140
-
141
-
142
-
143
-
144
-
145
-
146
-
147
-
148
-
149
-
150
-
151
-
152
-
153
-
154
-
155
-
156
-
157
-
158
-
159
-
160
-
161
-
162
-
163
-
164
-
165
-
166
-
167
-
168
-
169
-
170
-
171
-
172
-
173
-
174
-
175
-
176
-
177
-
178
-
179
-
180
-
181
-
182
-
183
-
184
-
185
-
186
-
187
-
188
-
189
-
190
-
191
-
192
-
193
-
194
-
195
-
196
-
197
-
198
-
199
-
200
-
201
-
202
-
203
-
204
-
205
-
206
-
207
-
208
-
209
-
210
-
211
-
212
-
213
-
214
-
215
-
216
-
217
-
218
-
219
-
220
-
221
-
222
-
223
-
224
-
225
-
226
-
227
-
228
-
229
-
230
-
231
-
232
-
233
-
234
-
235
-
236
-
237
-
238
-
239
-
240
-
241
-
 242
242 -
 243
243 -
 244
244 -
 245
245 -
 246
246 -
 247
247 -
 248
248 -
 249
249 -
 250
250 -
 251
251 -
 252
252 -
 253
253 -
 254
254 -
 255
255 -
 256
256 -
 257
257 -
 258
258 -
 259
259 -
 260
260 -
 261
261 -
 262
262 -
263
-
264
-
265
-
266
-
267
-
268
-
269
-
270
-
271
-
272
-
273
-
274
-
275
-
276
-
277
-
278
-
279
-
280
-
281
-
282
-
283
-
284
-
285
-
286
-
287
-
288
-
289
-
290
-
291
-
292
-
293
-
294
-
295
-
296
-
297
-
298
-
299
-
300
-
301
-
302
-
303
-
304
-
305
-
306
-
307
-
308
-
309
-
310
-
311
-
312
-
313
-
314
-
315
-
316
-
317
-
318
-
319
-
320
-
321
-
322
-
323
-
324
-
325
-
326
-
327
 |
 |

235
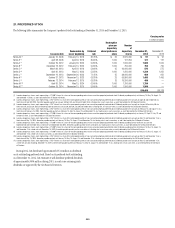
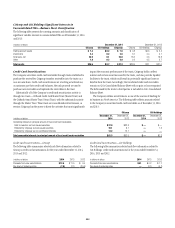
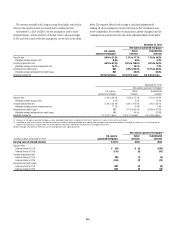
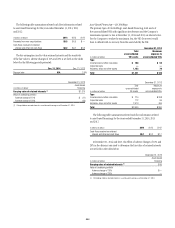
The interests retained by the Company range from highly rated and/or
senior in the capital structure to unrated and/or residual interests.
At December 31, 2014 and 2013, the key assumptions used to value
retained interests, and the sensitivity of the fair value to adverse changes
of 10% and 20% in each of the key assumptions, are set forth in the tables
below. The negative effect of each change is calculated independently,
holding all other assumptions constant. Because the key assumptions may
not be independent, the net effect of simultaneous adverse changes in the key
assumptions may be less than the sum of the individual effects shown below.
December 31, 2014
Non-agency-sponsored mortgages (1)
U.S. agency-
sponsored mortgages
Senior
interests
Subordinated
interests
Discount rate 0.0% to 21.2% 1.1% to 17.7% 1.3% to 19.6%
Weighted average discount rate 8.0% 4.9% 8.2%
Constant prepayment rate 6.0% to 41.4% 2.0% to 100.0% 0.5% to 16.2%
Weighted average constant prepayment rate 14.7% 10.1% 7.2%
Anticipated net credit losses (2) NM 0.0% to 92.4% 13.7% to 83.8%
Weighted average anticipated net credit losses NM 54.6% 52.5%
Weighted average life 0.0 to 16.0 years 0.3 to 14.4 years 0.0 to 24.4 years
December 31, 2013
Non-agency-sponsored mortgages (1)
U.S. agency-
sponsored mortgages
Senior
interests
Subordinated
interests
Discount rate 0.1% to 20.9% 0.5% to 17.4% 2.1% to 19.6%
Weighted average discount rate 6.9% 5.5% 11.2%
Constant prepayment rate 6.2% to 30.4% 1.3% to 100.0% 1.4% to 23.1%
Weighted average constant prepayment rate 11.1% 6.4% 7.4%
Anticipated net credit losses (2) NM 0.1% to 80.0% 25.5% to 81.9%
Weighted average anticipated net credit losses NM 49.5% 52.8%
Weighted average life 2.1 to 14.1 years 0.0 to 11.9 years 0.0 to 26.0 years
(1) Disclosure of non-agency-sponsored mortgages as senior and subordinated interests is indicative of the interests’ position in the capital structure of the securitization.
(2) Anticipated net credit losses represent estimated loss severity associated with defaulted mortgage loans underlying the mortgage securitizations disclosed above. Anticipated net credit losses, in this instance, do not
represent total credit losses incurred to date, nor do they represent credit losses expected on retained interests in mortgage securitizations.
NM Not meaningful. Anticipated net credit losses are not meaningful due to U.S. agency guarantees.
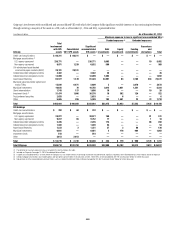
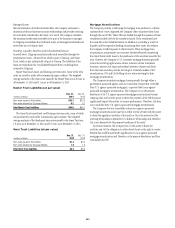
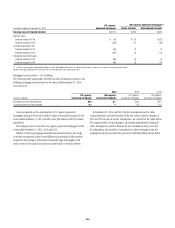
In millions of dollars at December 31, 2014
U.S. agency-
sponsored mortgages
Non-agency-sponsored mortgages (1)
Senior
interests
Subordinated
interests
Carrying value of retained interests $ 2,224 $ 285 $554
Discount rates
Adverse change of 10% $ (64) $ (5) $ (30)
Adverse change of 20% (124) (9) (57)
Constant prepayment rate
Adverse change of 10% (86) (1) (9)
Adverse change of 20% (165) (2) (18)
Anticipated net credit losses
Adverse change of 10% NM (2) (9)
Adverse change of 20% NM (3) (16)