Citibank 2014 Annual Report Download - page 61
Download and view the complete annual report
Please find page 61 of the 2014 Citibank annual report below. You can navigate through the pages in the report by either clicking on the pages listed below, or by using the keyword search tool below to find specific information within the annual report.-
 1
1 -
2
-
3
-
4
-
5
-
6
-
7
-
8
-
9
-
10
-
11
-
12
-
13
-
14
-
15
-
16
-
17
-
18
-
19
-
20
-
21
-
22
-
23
-
24
-
25
-
26
-
27
-
28
-
29
-
30
-
31
-
32
-
33
-
34
-
35
-
36
-
37
-
38
-
39
-
40
-
41
-
42
-
43
-
44
-
45
-
46
-
47
-
48
-
49
-
50
-
 51
51 -
 52
52 -
 53
53 -
 54
54 -
 55
55 -
 56
56 -
 57
57 -
 58
58 -
 59
59 -
 60
60 -
 61
61 -
 62
62 -
 63
63 -
 64
64 -
 65
65 -
 66
66 -
 67
67 -
 68
68 -
 69
69 -
 70
70 -
 71
71 -
72
-
73
-
74
-
75
-
76
-
77
-
78
-
79
-
80
-
81
-
82
-
83
-
84
-
85
-
86
-
87
-
88
-
89
-
90
-
91
-
92
-
93
-
94
-
95
-
96
-
97
-
98
-
99
-
100
-
101
-
102
-
103
-
104
-
105
-
106
-
107
-
108
-
109
-
110
-
111
-
112
-
113
-
114
-
115
-
116
-
117
-
118
-
119
-
120
-
121
-
122
-
123
-
124
-
125
-
126
-
127
-
128
-
129
-
130
-
131
-
132
-
133
-
134
-
135
-
136
-
137
-
138
-
139
-
140
-
141
-
142
-
143
-
144
-
145
-
146
-
147
-
148
-
149
-
150
-
151
-
152
-
153
-
154
-
155
-
156
-
157
-
158
-
159
-
160
-
161
-
162
-
163
-
164
-
165
-
166
-
167
-
168
-
169
-
170
-
171
-
172
-
173
-
174
-
175
-
176
-
177
-
178
-
179
-
180
-
181
-
182
-
183
-
184
-
185
-
186
-
187
-
188
-
189
-
190
-
191
-
192
-
193
-
194
-
195
-
196
-
197
-
198
-
199
-
200
-
201
-
202
-
203
-
204
-
205
-
206
-
207
-
208
-
209
-
210
-
211
-
212
-
213
-
214
-
215
-
216
-
217
-
218
-
219
-
220
-
221
-
222
-
223
-
224
-
225
-
226
-
227
-
228
-
229
-
230
-
231
-
232
-
233
-
234
-
235
-
236
-
237
-
238
-
239
-
240
-
241
-
242
-
243
-
244
-
245
-
246
-
247
-
248
-
249
-
250
-
251
-
252
-
253
-
254
-
255
-
256
-
257
-
258
-
259
-
260
-
261
-
262
-
263
-
264
-
265
-
266
-
267
-
268
-
269
-
270
-
271
-
272
-
273
-
274
-
275
-
276
-
277
-
278
-
279
-
280
-
281
-
282
-
283
-
284
-
285
-
286
-
287
-
288
-
289
-
290
-
291
-
292
-
293
-
294
-
295
-
296
-
297
-
298
-
299
-
300
-
301
-
302
-
303
-
304
-
305
-
306
-
307
-
308
-
309
-
310
-
311
-
312
-
313
-
314
-
315
-
316
-
317
-
318
-
319
-
320
-
321
-
322
-
323
-
324
-
325
-
326
-
327
 |
 |

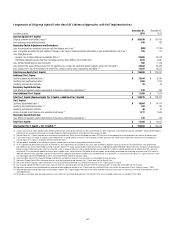
44
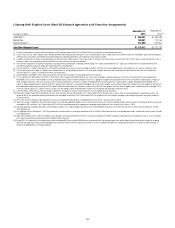
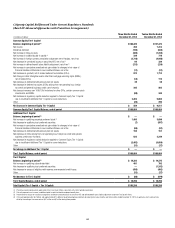
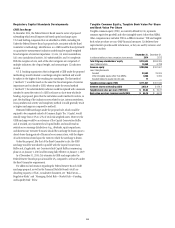
Capital Resources of Citigroup’s Subsidiary U.S. Depository
Institutions Under Current Regulatory Standards
Citigroup’s subsidiary U.S. depository institutions are also subject to
regulatory capital standards issued by their respective primary federal
bank regulatory agencies, which are similar to the standards of the Federal
Reserve Board.
The following table sets forth the capital tiers, risk-weighted assets,
quarterly adjusted average total assets and capital ratios under current
regulatory standards (reflecting Basel III Transition Arrangements) for
Citibank, N.A., Citi’s primary subsidiary U.S. depository institution, as of
December 31, 2014 and December 31, 2013.
Citibank, N.A. Capital Components and Ratios Under Current Regulatory Standards (Basel III Transition Arrangements)
December 31, 2014 December 31, 2013 (1)
In millions of dollars, except ratios
Advanced
Approaches
Standardized
Approach (2)
Advanced
Approaches
Standardized
Approach (2)
Common Equity Tier 1 Capital $ 129,135 $ 129,135 $ 128,317 $ 128,317
Tier 1 Capital 129,135 129,135 128,317 128,317
Total Capital (Tier 1 Capital + Tier 2 Capital) (3) 140,119 150,215 137,277 146,267
Risk-Weighted Assets 946,333 906,250 893,390 910,553
Quarterly Adjusted Average Total Assets (4) 1,367,444 1,367,444 1,321,440 1,321,440
Common Equity Tier 1 Capital ratio (5) 13.65% 14.25% 14.36% 14.09%
Tier 1 Capital ratio (5) 13.65 14.25 14.36 14.09
Total Capital ratio (5) 14.81 16.58 15.37 16.06
Tier 1 Leverage ratio 9.44 9.44 9.71 9.71
(1) Pro forma presentation based on application of the Final Basel III Rules consistent with current period presentation.
(2) Basel III 2014 Standardized Approach which reflects the application of the Basel I credit risk and Basel II.5 market risk capital rules.
(3) Under the Advanced Approaches framework eligible credit reserves that exceed expected credit losses are eligible for inclusion in Tier 2 Capital to the extent the excess reserves do not exceed 0.6% of credit
risk-weighted assets, which differs from the Standardized Approach in which the allowance for credit losses is includable in Tier 2 Capital up to 1.25% of credit risk-weighted assets, with any excess allowance for
credit losses being deducted in arriving at credit risk-weighted assets.
(4) Tier 1 Leverage ratio denominator.
(5) As of December 31, 2014, Citibank, N.A.’s reportable Common Equity Tier 1 Capital, Tier 1 Capital, and Total Capital ratios were the lower derived under the Basel III Advanced Approaches. As of December 31, 2013,
Citibank, N.A.’s reportable Common Equity Tier 1 Capital and Tier 1 Capital ratios were the lower derived under the Basel III 2014 Standardized Approach (Basel I credit risk and Basel II.5 market risk capital rules),
whereas the reportable Total Capital ratio was the lower derived under the Advanced Approaches framework.