Citibank 2014 Annual Report Download - page 50
Download and view the complete annual report
Please find page 50 of the 2014 Citibank annual report below. You can navigate through the pages in the report by either clicking on the pages listed below, or by using the keyword search tool below to find specific information within the annual report.-
 1
1 -
2
-
3
-
4
-
5
-
6
-
7
-
8
-
9
-
10
-
11
-
12
-
13
-
14
-
15
-
16
-
17
-
18
-
19
-
20
-
21
-
22
-
23
-
24
-
25
-
26
-
27
-
28
-
29
-
30
-
31
-
32
-
33
-
34
-
35
-
36
-
37
-
38
-
39
-
 40
40 -
 41
41 -
 42
42 -
 43
43 -
 44
44 -
 45
45 -
 46
46 -
 47
47 -
 48
48 -
 49
49 -
 50
50 -
 51
51 -
 52
52 -
 53
53 -
 54
54 -
 55
55 -
 56
56 -
 57
57 -
 58
58 -
 59
59 -
 60
60 -
61
-
62
-
63
-
64
-
65
-
66
-
67
-
68
-
69
-
70
-
71
-
72
-
73
-
74
-
75
-
76
-
77
-
78
-
79
-
80
-
81
-
82
-
83
-
84
-
85
-
86
-
87
-
88
-
89
-
90
-
91
-
92
-
93
-
94
-
95
-
96
-
97
-
98
-
99
-
100
-
101
-
102
-
103
-
104
-
105
-
106
-
107
-
108
-
109
-
110
-
111
-
112
-
113
-
114
-
115
-
116
-
117
-
118
-
119
-
120
-
121
-
122
-
123
-
124
-
125
-
126
-
127
-
128
-
129
-
130
-
131
-
132
-
133
-
134
-
135
-
136
-
137
-
138
-
139
-
140
-
141
-
142
-
143
-
144
-
145
-
146
-
147
-
148
-
149
-
150
-
151
-
152
-
153
-
154
-
155
-
156
-
157
-
158
-
159
-
160
-
161
-
162
-
163
-
164
-
165
-
166
-
167
-
168
-
169
-
170
-
171
-
172
-
173
-
174
-
175
-
176
-
177
-
178
-
179
-
180
-
181
-
182
-
183
-
184
-
185
-
186
-
187
-
188
-
189
-
190
-
191
-
192
-
193
-
194
-
195
-
196
-
197
-
198
-
199
-
200
-
201
-
202
-
203
-
204
-
205
-
206
-
207
-
208
-
209
-
210
-
211
-
212
-
213
-
214
-
215
-
216
-
217
-
218
-
219
-
220
-
221
-
222
-
223
-
224
-
225
-
226
-
227
-
228
-
229
-
230
-
231
-
232
-
233
-
234
-
235
-
236
-
237
-
238
-
239
-
240
-
241
-
242
-
243
-
244
-
245
-
246
-
247
-
248
-
249
-
250
-
251
-
252
-
253
-
254
-
255
-
256
-
257
-
258
-
259
-
260
-
261
-
262
-
263
-
264
-
265
-
266
-
267
-
268
-
269
-
270
-
271
-
272
-
273
-
274
-
275
-
276
-
277
-
278
-
279
-
280
-
281
-
282
-
283
-
284
-
285
-
286
-
287
-
288
-
289
-
290
-
291
-
292
-
293
-
294
-
295
-
296
-
297
-
298
-
299
-
300
-
301
-
302
-
303
-
304
-
305
-
306
-
307
-
308
-
309
-
310
-
311
-
312
-
313
-
314
-
315
-
316
-
317
-
318
-
319
-
320
-
321
-
322
-
323
-
324
-
325
-
326
-
327
 |
 |

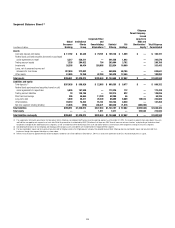
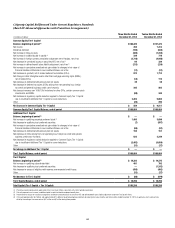
33
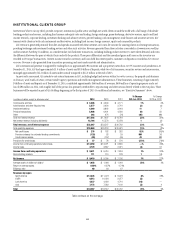
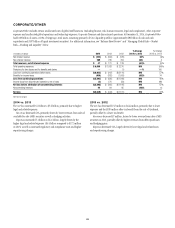
Segment Balance Sheet (1)
In millions of dollars
Global
Consumer
Banking
Institutional
Clients
Group
Corporate/Other
and
Consolidating
Eliminations (2)
Subtotal
Citicorp
Citi
Holdings
Citigroup
Parent Company-
Issued
Long-Term
Debt and
Stockholders’
Equity (3)
Total Citigroup
Consolidated
Assets
Cash and deposits with banks $ 17,192 $ 62,245 $ 79,701 $ 159,138 $ 1,059 $ — $ 160,197
Federal funds sold and securities borrowed or purchased
under agreements to resell 5,317 236,211 — 241,528 1,042 — 242,570
Trading account assets 7,328 284,922 754 293,004 3,782 — 296,786
Investments 26,395 90,434 205,805 322,634 10,809 — 333,443
Loans, net of unearned income and
allowance for loan losses 287,934 272,002 — 559,936 68,705 — 628,641
Other assets 51,885 74,259 42,284 168,428 12,465 — 180,893
Total assets $396,051 $1,020,073 $328,544 $1,744,668 $ 97,862 $ — $1,842,530
Liabilities and equity
Total deposits (4) $307,626 $ 558,926 $ 22,803 $ 889,355 $ 9,977 $ — $ 899,332
Federal funds purchased and securities loaned or sold
under agreements to repurchase 5,826 167,500 — 173,326 112 — 173,438
Trading account liabilities 19 138,195 — 138,214 822 — 139,036
Short-term borrowings 396 46,664 11,229 58,289 46 — 58,335
Long-term debt 1,939 35,411 29,349 66,699 6,869 149,512 223,080
Other liabilities 39,210 74,353 15,181 128,744 8,520 — 137,264
Net inter-segment funding (lending) 41,035 (976) 248,471 288,530 71,516 (360,046) —
Total liabilities $396,051 $1,020,073 $327,033 $1,743,157 $ 97,862 $(210,534) $1,630,485
Total equity — — 1,511 1,511 — 210,534 212,045
Total liabilities and equity $396,051 $1,020,073 $328,544 $1,744,668 $ 97,862 $ — $1,842,530
(1) The supplemental information presented in the table above reflects Citigroup’s consolidated GAAP balance sheet by reporting segment as of December 31, 2014. The respective segment information depicts the assets
and liabilities managed by each segment as of such date. While this presentation is not defined by GAAP, Citi believes that these non-GAAP financial measures enhance investors’ understanding of the balance sheet
components managed by the underlying business segments, as well as the beneficial inter-relationships of the asset and liability dynamics of the balance sheet components among Citi’s business segments.
(2) Consolidating eliminations for total Citigroup and Citigroup parent company assets and liabilities are recorded within the Corporate/Other segment.
(3) The total stockholders’ equity and the majority of long-term debt of Citigroup reside in the Citigroup parent company Consolidated Balance Sheet. Citigroup allocates stockholders’ equity and long-term debt to its
businesses through inter-segment allocations as shown above.
(4) Reflects reclassification of approximately $21 billion of deposits to held-for-sale (Other liabilities) at December 31, 2014 as a result of the agreement to sell Citi’s retail banking business in Japan.