Citibank 2014 Annual Report Download - page 115
Download and view the complete annual report
Please find page 115 of the 2014 Citibank annual report below. You can navigate through the pages in the report by either clicking on the pages listed below, or by using the keyword search tool below to find specific information within the annual report.-
 1
1 -
2
-
3
-
4
-
5
-
6
-
7
-
8
-
9
-
10
-
11
-
12
-
13
-
14
-
15
-
16
-
17
-
18
-
19
-
20
-
21
-
22
-
23
-
24
-
25
-
26
-
27
-
28
-
29
-
30
-
31
-
32
-
33
-
34
-
35
-
36
-
37
-
38
-
39
-
40
-
41
-
42
-
43
-
44
-
45
-
46
-
47
-
48
-
49
-
50
-
51
-
52
-
53
-
54
-
55
-
56
-
57
-
58
-
59
-
60
-
61
-
62
-
63
-
64
-
65
-
66
-
67
-
68
-
69
-
70
-
71
-
72
-
73
-
74
-
75
-
76
-
77
-
78
-
79
-
80
-
81
-
82
-
83
-
84
-
85
-
86
-
87
-
88
-
89
-
90
-
91
-
92
-
93
-
94
-
95
-
96
-
97
-
98
-
99
-
100
-
101
-
102
-
103
-
104
-
 105
105 -
 106
106 -
 107
107 -
 108
108 -
 109
109 -
 110
110 -
 111
111 -
 112
112 -
 113
113 -
 114
114 -
 115
115 -
 116
116 -
 117
117 -
 118
118 -
 119
119 -
 120
120 -
 121
121 -
 122
122 -
 123
123 -
 124
124 -
 125
125 -
126
-
127
-
128
-
129
-
130
-
131
-
132
-
133
-
134
-
135
-
136
-
137
-
138
-
139
-
140
-
141
-
142
-
143
-
144
-
145
-
146
-
147
-
148
-
149
-
150
-
151
-
152
-
153
-
154
-
155
-
156
-
157
-
158
-
159
-
160
-
161
-
162
-
163
-
164
-
165
-
166
-
167
-
168
-
169
-
170
-
171
-
172
-
173
-
174
-
175
-
176
-
177
-
178
-
179
-
180
-
181
-
182
-
183
-
184
-
185
-
186
-
187
-
188
-
189
-
190
-
191
-
192
-
193
-
194
-
195
-
196
-
197
-
198
-
199
-
200
-
201
-
202
-
203
-
204
-
205
-
206
-
207
-
208
-
209
-
210
-
211
-
212
-
213
-
214
-
215
-
216
-
217
-
218
-
219
-
220
-
221
-
222
-
223
-
224
-
225
-
226
-
227
-
228
-
229
-
230
-
231
-
232
-
233
-
234
-
235
-
236
-
237
-
238
-
239
-
240
-
241
-
242
-
243
-
244
-
245
-
246
-
247
-
248
-
249
-
250
-
251
-
252
-
253
-
254
-
255
-
256
-
257
-
258
-
259
-
260
-
261
-
262
-
263
-
264
-
265
-
266
-
267
-
268
-
269
-
270
-
271
-
272
-
273
-
274
-
275
-
276
-
277
-
278
-
279
-
280
-
281
-
282
-
283
-
284
-
285
-
286
-
287
-
288
-
289
-
290
-
291
-
292
-
293
-
294
-
295
-
296
-
297
-
298
-
299
-
300
-
301
-
302
-
303
-
304
-
305
-
306
-
307
-
308
-
309
-
310
-
311
-
312
-
313
-
314
-
315
-
316
-
317
-
318
-
319
-
320
-
321
-
322
-
323
-
324
-
325
-
326
-
327
 |
 |

98
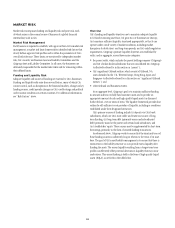
Secured Funding Transactions and Short-Term Borrowings
Secured Funding
Secured funding is primarily conducted through Citi’s broker-dealer
subsidiaries to fund efficiently both secured lending activity and a portion of
trading inventory. Citi also conducts a smaller portion of its secured funding
transactions through its bank entities, which is typically collateralized by
foreign government securities. Generally, daily changes in the level of Citi’s
secured funding are primarily due to fluctuations in secured lending activity
in the matched book (as described below) and trading inventory.
Secured funding declined to $173 billion as of December 31, 2014,
compared to $176 billion as of September 30, 2014 and $204 billion as of
December 31, 2013, due to the impact of FX translation and Citi’s continued
optimization of secured funding. Average balances for secured funding
were approximately $187 billion for the quarter ended December 31, 2014,
compared to $182 billion for the quarter ended September 30, 2014 and $211
billion for the quarter ended December 31, 2013.
The portion of secured funding in the broker-dealer subsidiaries that
funds secured lending is commonly referred to as “matched book” activity.
The majority of this activity is secured by high quality, liquid securities such
as U.S. Treasury securities, U.S. agency securities and foreign sovereign
debt. Other secured funding is secured by less liquid securities, including
equity securities, corporate bonds and asset-backed securities. The tenor
of Citi’s matched book liabilities is equal to or longer than the tenor of the
corresponding matched book assets.
The remainder of the secured funding activity in the broker-dealer
subsidiaries serves to fund trading inventory. To maintain reliable funding
under a wide range of market conditions, including under periods of stress,
Citi manages these activities by taking into consideration the quality of the
underlying collateral, and stipulating financing tenor. The weighted average
maturity of Citi’s secured funding of less liquid trading inventory was greater
than 110 days as of December 31, 2014.
Citi manages the risks in its secured funding by conducting daily stress
tests to account for changes in capacity, tenors, haircut, collateral profile and
client actions. Additionally, Citi maintains counterparty diversification by
establishing concentration triggers and assessing counterparty reliability and
stability under stress. Citi generally sources secured funding from more than
150 counterparties.
Short-Term Borrowings
As referenced above, Citi supplements its primary sources of funding with
short-term borrowings. Short-term borrowings generally include (i) secured
funding transactions (securities loaned or sold under agreements to
repurchase, or repos) and (ii) to a lesser extent, short-term borrowings
consisting of commercial paper and borrowings from the FHLB and other
market participants (see Note 18 to the Consolidated Financial Statements
for further information on Citigroup’s and its affiliates’ outstanding
short-term borrowings).
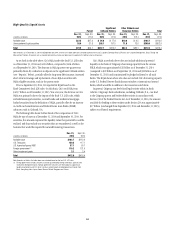
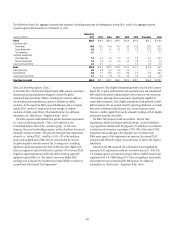
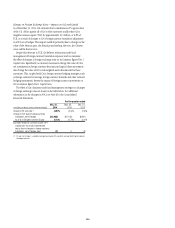
The following table contains the year-end, average and maximum month-end amounts for the following respective short-term borrowings categories at the
end of each of the three prior fiscal years.
Federal funds purchased and
securities sold under
agreements to repurchase
Short-term borrowings (1)
Commercial paper (2) Other short-term borrowings (3)
In billions of dollars 2014 2013 2012 2014 2013 2012 2014 2013 2012
Amounts outstanding at year end $173.4 $203.5 $211.2 $16.2 $17.9 $11.5 $42.1 $41.0 $40.5
Average outstanding during the year (4)(5) 190.0 229.4 223.8 16.8 16.3 17.9 45.3 39.6 36.3
Maximum month-end outstanding 200.1 239.9 237.1 17.9 18.8 21.9 47.1 44.7 40.6
Weighted-average interest rate
During the year (4)(5)(6) 1.00% 1.02% 1.26% 0.21% 0.28% 0.47% 1.20% 1.39% 1.77%
At year end (7) 0.49 0.59 0.81 0.23 0.26 0.38 0.53 0.87 1.06
(1) Original maturities of less than one year.
(2) Substantially all commercial paper outstanding was issued by significant Citibank entities for the periods presented. The increase in commercial paper outstanding during 2013 was due to the consolidation of $7 billion
of borrowings related to trade loans in the second quarter of 2013.
(3) Other short-term borrowings include borrowings from the FHLB and other market participants.
(4) Interest rates and amounts include the effects of risk management activities associated with the respective liability categories.
(5) Average volumes of securities loaned or sold under agreements to repurchase are reported net pursuant to FIN 41 (ASC 210-20-45); average rates exclude the impact of FIN 41 (ASC 210-20-45).
(6) Average rates reflect prevailing local interest rates, including inflationary effects and monetary correction in certain countries.
(7) Based on contractual rates at respective year ends; non-interest-bearing accounts are excluded from the weighted average interest rate calculated at year end.