Citibank 2014 Annual Report Download - page 154
Download and view the complete annual report
Please find page 154 of the 2014 Citibank annual report below. You can navigate through the pages in the report by either clicking on the pages listed below, or by using the keyword search tool below to find specific information within the annual report.-
 1
1 -
2
-
3
-
4
-
5
-
6
-
7
-
8
-
9
-
10
-
11
-
12
-
13
-
14
-
15
-
16
-
17
-
18
-
19
-
20
-
21
-
22
-
23
-
24
-
25
-
26
-
27
-
28
-
29
-
30
-
31
-
32
-
33
-
34
-
35
-
36
-
37
-
38
-
39
-
40
-
41
-
42
-
43
-
44
-
45
-
46
-
47
-
48
-
49
-
50
-
51
-
52
-
53
-
54
-
55
-
56
-
57
-
58
-
59
-
60
-
61
-
62
-
63
-
64
-
65
-
66
-
67
-
68
-
69
-
70
-
71
-
72
-
73
-
74
-
75
-
76
-
77
-
78
-
79
-
80
-
81
-
82
-
83
-
84
-
85
-
86
-
87
-
88
-
89
-
90
-
91
-
92
-
93
-
94
-
95
-
96
-
97
-
98
-
99
-
100
-
101
-
102
-
103
-
104
-
105
-
106
-
107
-
108
-
109
-
110
-
111
-
112
-
113
-
114
-
115
-
116
-
117
-
118
-
119
-
120
-
121
-
122
-
123
-
124
-
125
-
126
-
127
-
128
-
129
-
130
-
131
-
132
-
133
-
134
-
135
-
136
-
137
-
138
-
139
-
140
-
141
-
142
-
143
-
 144
144 -
 145
145 -
 146
146 -
 147
147 -
 148
148 -
 149
149 -
 150
150 -
 151
151 -
 152
152 -
 153
153 -
 154
154 -
 155
155 -
 156
156 -
 157
157 -
 158
158 -
 159
159 -
 160
160 -
 161
161 -
 162
162 -
 163
163 -
 164
164 -
165
-
166
-
167
-
168
-
169
-
170
-
171
-
172
-
173
-
174
-
175
-
176
-
177
-
178
-
179
-
180
-
181
-
182
-
183
-
184
-
185
-
186
-
187
-
188
-
189
-
190
-
191
-
192
-
193
-
194
-
195
-
196
-
197
-
198
-
199
-
200
-
201
-
202
-
203
-
204
-
205
-
206
-
207
-
208
-
209
-
210
-
211
-
212
-
213
-
214
-
215
-
216
-
217
-
218
-
219
-
220
-
221
-
222
-
223
-
224
-
225
-
226
-
227
-
228
-
229
-
230
-
231
-
232
-
233
-
234
-
235
-
236
-
237
-
238
-
239
-
240
-
241
-
242
-
243
-
244
-
245
-
246
-
247
-
248
-
249
-
250
-
251
-
252
-
253
-
254
-
255
-
256
-
257
-
258
-
259
-
260
-
261
-
262
-
263
-
264
-
265
-
266
-
267
-
268
-
269
-
270
-
271
-
272
-
273
-
274
-
275
-
276
-
277
-
278
-
279
-
280
-
281
-
282
-
283
-
284
-
285
-
286
-
287
-
288
-
289
-
290
-
291
-
292
-
293
-
294
-
295
-
296
-
297
-
298
-
299
-
300
-
301
-
302
-
303
-
304
-
305
-
306
-
307
-
308
-
309
-
310
-
311
-
312
-
313
-
314
-
315
-
316
-
317
-
318
-
319
-
320
-
321
-
322
-
323
-
324
-
325
-
326
-
327
 |
 |

137
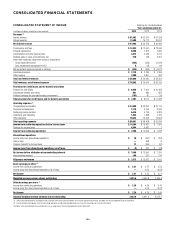
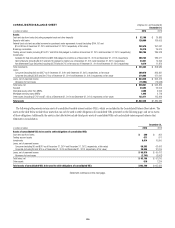
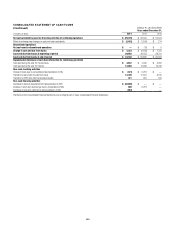
CONSOLIDATED BALANCE SHEET
(Continued)
Citigroup Inc. and Subsidiaries
December 31,
In millions of dollars, except shares and per share amounts 2014 2013
Liabilities
Non-interest-bearing deposits in U.S. offices $ 128,958 $ 128,399
Interest-bearing deposits in U.S. offices (including $994 and $988 as of December 31, 2014 and
December 31, 2013, respectively, at fair value) 284,978 284,164
Non-interest-bearing deposits in offices outside the U.S. 70,925 69,406
Interest-bearing deposits in offices outside the U.S. (including $690 and $689 as of December 31, 2014 and
December 31, 2013, respectively, at fair value) 414,471 486,304
Total deposits $ 899,332 $ 968,273
Federal funds purchased and securities loaned or sold under agreements to repurchase
(including $36,725 and $54,147 as of December 31, 2014 and December 31, 2013, respectively, at fair value) 173,438 203,512
Brokerage payables 52,180 53,707
Trading account liabilities 139,036 108,762
Short-term borrowings (including $1,496 and $3,692 as of December 31, 2014 and December 31, 2013, respectively, at fair value) 58,335 58,944
Long-term debt (including $26,180 and $26,877 as of December 31, 2014 and December 31, 2013, respectively, at fair value) 223,080 221,116
Other liabilities (including $1,776 and $2,011 as of December 31, 2014 and December 31, 2013, respectively, at fair value) 85,084 59,935
Total liabilities $1,630,485 $1,674,249
Stockholders’ equity
Preferred stock ($1.00 par value; authorized shares: 30 million), issued shares: 418,720 as of
December 31, 2014 and 269,520 as of December 31, 2013, at aggregate liquidation value $ 10,468 $ 6,738
Common stock ($0.01 par value; authorized shares: 6 billion), issued shares: 3,082,037,568 as of
December 31, 2014 and 3,062,098,976 as of December 31, 2013 31 31
Additional paid-in capital 107,979 107,193
Retained earnings 118,201 111,168
Treasury stock, at cost: December 31, 2014—58,119,993 shares and December 31, 2013—32,856,062 shares (2,929) (1,658)
Accumulated other comprehensive income (loss) (23,216) (19,133)
Total Citigroup stockholders’ equity $ 210,534 $ 204,339
Noncontrolling interest 1,511 1,794
Total equity $ 212,045 $ 206,133
Total liabilities and equity $1,842,530 $1,880,382
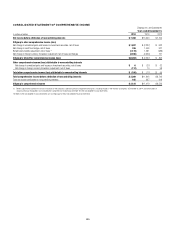
The following table presents certain liabilities of consolidated VIEs, which are included in the Consolidated Balance Sheet above. The liabilities in the table
below include third-party liabilities of consolidated VIEs only and exclude intercompany balances that eliminate in consolidation. The liabilities also exclude
amounts where creditors or beneficial interest holders have recourse to the general credit of Citigroup.
December 31,
In millions of dollars 2014 2013
Liabilities of consolidated VIEs for which creditors or beneficial interest holders do not have
recourse to the general credit of Citigroup
Short-term borrowings $20,254 $21,793
Long-term debt (including $0 and $909 as of December 31, 2014 and December 31, 2013, respectively, at fair value) 40,078 34,743
Other liabilities 901 999
Total liabilities of consolidated VIEs for which creditors or beneficial interest holders do not have
recourse to the general credit of Citigroup $61,233 $57,535
The Notes to the Consolidated Financial Statements are an integral part of these Consolidated Financial Statements.