Citibank 2014 Annual Report Download - page 190
Download and view the complete annual report
Please find page 190 of the 2014 Citibank annual report below. You can navigate through the pages in the report by either clicking on the pages listed below, or by using the keyword search tool below to find specific information within the annual report.-
 1
1 -
2
-
3
-
4
-
5
-
6
-
7
-
8
-
9
-
10
-
11
-
12
-
13
-
14
-
15
-
16
-
17
-
18
-
19
-
20
-
21
-
22
-
23
-
24
-
25
-
26
-
27
-
28
-
29
-
30
-
31
-
32
-
33
-
34
-
35
-
36
-
37
-
38
-
39
-
40
-
41
-
42
-
43
-
44
-
45
-
46
-
47
-
48
-
49
-
50
-
51
-
52
-
53
-
54
-
55
-
56
-
57
-
58
-
59
-
60
-
61
-
62
-
63
-
64
-
65
-
66
-
67
-
68
-
69
-
70
-
71
-
72
-
73
-
74
-
75
-
76
-
77
-
78
-
79
-
80
-
81
-
82
-
83
-
84
-
85
-
86
-
87
-
88
-
89
-
90
-
91
-
92
-
93
-
94
-
95
-
96
-
97
-
98
-
99
-
100
-
101
-
102
-
103
-
104
-
105
-
106
-
107
-
108
-
109
-
110
-
111
-
112
-
113
-
114
-
115
-
116
-
117
-
118
-
119
-
120
-
121
-
122
-
123
-
124
-
125
-
126
-
127
-
128
-
129
-
130
-
131
-
132
-
133
-
134
-
135
-
136
-
137
-
138
-
139
-
140
-
141
-
142
-
143
-
144
-
145
-
146
-
147
-
148
-
149
-
150
-
151
-
152
-
153
-
154
-
155
-
156
-
157
-
158
-
159
-
160
-
161
-
162
-
163
-
164
-
165
-
166
-
167
-
168
-
169
-
170
-
171
-
172
-
173
-
174
-
175
-
176
-
177
-
178
-
179
-
 180
180 -
 181
181 -
 182
182 -
 183
183 -
 184
184 -
 185
185 -
 186
186 -
 187
187 -
 188
188 -
 189
189 -
 190
190 -
 191
191 -
 192
192 -
 193
193 -
 194
194 -
 195
195 -
 196
196 -
 197
197 -
 198
198 -
 199
199 -
 200
200 -
201
-
202
-
203
-
204
-
205
-
206
-
207
-
208
-
209
-
210
-
211
-
212
-
213
-
214
-
215
-
216
-
217
-
218
-
219
-
220
-
221
-
222
-
223
-
224
-
225
-
226
-
227
-
228
-
229
-
230
-
231
-
232
-
233
-
234
-
235
-
236
-
237
-
238
-
239
-
240
-
241
-
242
-
243
-
244
-
245
-
246
-
247
-
248
-
249
-
250
-
251
-
252
-
253
-
254
-
255
-
256
-
257
-
258
-
259
-
260
-
261
-
262
-
263
-
264
-
265
-
266
-
267
-
268
-
269
-
270
-
271
-
272
-
273
-
274
-
275
-
276
-
277
-
278
-
279
-
280
-
281
-
282
-
283
-
284
-
285
-
286
-
287
-
288
-
289
-
290
-
291
-
292
-
293
-
294
-
295
-
296
-
297
-
298
-
299
-
300
-
301
-
302
-
303
-
304
-
305
-
306
-
307
-
308
-
309
-
310
-
311
-
312
-
313
-
314
-
315
-
316
-
317
-
318
-
319
-
320
-
321
-
322
-
323
-
324
-
325
-
326
-
327
 |
 |

173
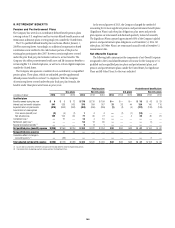
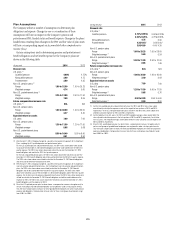
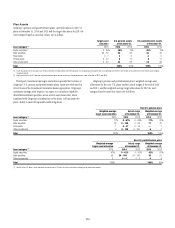
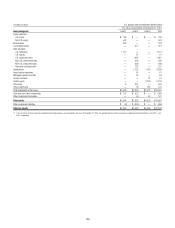
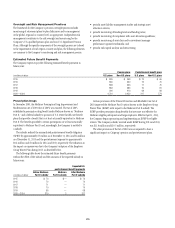
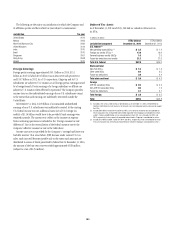
Plan Assets
Citigroup’s pension and postretirement plans’ asset allocations for the U.S.
plans at December 31, 2014 and 2013 and the target allocations for 2015 by
asset category based on asset fair values, are as follows:
Target asset
allocation
U.S. pension assets
at December 31,
U.S. postretirement assets
at December 31,
Asset category (1) 2015 2014 2013 2014 2013
Equity securities (2) 0 - 30% 20% 19% 20% 19%
Debt securities 25 - 73 44 42 44 42
Real estate 0 - 7 4545
Private equity 0 - 10 811 811
Other investments 0 - 22 24 23 24 23
Total 100% 100% 100% 100%
(1) Asset allocations for the U.S. plans are set by investment strategy, not by investment product. For example, private equities with an underlying investment in real estate are classified in the real estate asset category,
not private equity.
(2) Equity securities in the U.S. pension and postretirement plans do not include any Citigroup common stock at the end of 2014 and 2013.
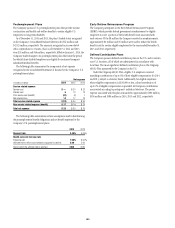
Third-party investment managers and advisors provide their services to
Citigroup’s U.S. pension and postretirement plans. Assets are rebalanced as
Citi’s Pension Plan Investment Committee deems appropriate. Citigroup’s
investment strategy, with respect to its assets, is to maintain a globally
diversified investment portfolio across several asset classes that, when
combined with Citigroup’s contributions to the plans, will maintain the
plans’ ability to meet all required benefit obligations.
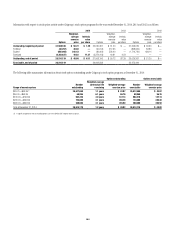
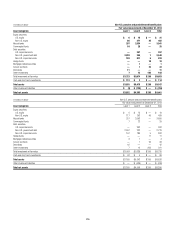
Citigroup’s pension and postretirement plans’ weighted-average asset
allocations for the non-U.S. plans and the actual ranges at the end of 2014
and 2013, and the weighted-average target allocations for 2015 by asset
category based on asset fair values are as follows:
Non-U.S. pension plans
Weighted-average
target asset allocation
Actual range
at December 31,
Weighted-average
at December 31,
Asset category (1) 2015 2014 2013 2014 2013
Equity securities 17% 0 - 67% 0 - 69% 17% 20%
Debt securities 78 0 - 100 0 - 99 77 72
Real estate 1 0 - 21 0 - 19 —1
Other investments 4 0 - 100 0 - 100 67
Total 100% 100% 100%
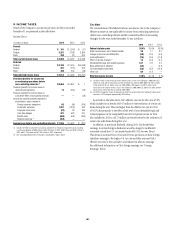
Non-U.S. postretirement plans
Weighted-average
target asset allocation
Actual range
at December 31,
Weighted-average
at December 31,
Asset category (1) 2015 2014 2013 2014 2013
Equity securities 41% 0 - 42% 0 - 41% 42% 41%
Debt securities 56 54 - 100 51 - 100 54 51
Other investments 3 0 - 4 0 - 8 48
Total 100% 100% 100%
(1) Similar to the U.S. plans, asset allocations for certain non-U.S. plans are set by investment strategy, not by investment product.