Citibank 2014 Annual Report Download - page 226
Download and view the complete annual report
Please find page 226 of the 2014 Citibank annual report below. You can navigate through the pages in the report by either clicking on the pages listed below, or by using the keyword search tool below to find specific information within the annual report.-
 1
1 -
2
-
3
-
4
-
5
-
6
-
7
-
8
-
9
-
10
-
11
-
12
-
13
-
14
-
15
-
16
-
17
-
18
-
19
-
20
-
21
-
22
-
23
-
24
-
25
-
26
-
27
-
28
-
29
-
30
-
31
-
32
-
33
-
34
-
35
-
36
-
37
-
38
-
39
-
40
-
41
-
42
-
43
-
44
-
45
-
46
-
47
-
48
-
49
-
50
-
51
-
52
-
53
-
54
-
55
-
56
-
57
-
58
-
59
-
60
-
61
-
62
-
63
-
64
-
65
-
66
-
67
-
68
-
69
-
70
-
71
-
72
-
73
-
74
-
75
-
76
-
77
-
78
-
79
-
80
-
81
-
82
-
83
-
84
-
85
-
86
-
87
-
88
-
89
-
90
-
91
-
92
-
93
-
94
-
95
-
96
-
97
-
98
-
99
-
100
-
101
-
102
-
103
-
104
-
105
-
106
-
107
-
108
-
109
-
110
-
111
-
112
-
113
-
114
-
115
-
116
-
117
-
118
-
119
-
120
-
121
-
122
-
123
-
124
-
125
-
126
-
127
-
128
-
129
-
130
-
131
-
132
-
133
-
134
-
135
-
136
-
137
-
138
-
139
-
140
-
141
-
142
-
143
-
144
-
145
-
146
-
147
-
148
-
149
-
150
-
151
-
152
-
153
-
154
-
155
-
156
-
157
-
158
-
159
-
160
-
161
-
162
-
163
-
164
-
165
-
166
-
167
-
168
-
169
-
170
-
171
-
172
-
173
-
174
-
175
-
176
-
177
-
178
-
179
-
180
-
181
-
182
-
183
-
184
-
185
-
186
-
187
-
188
-
189
-
190
-
191
-
192
-
193
-
194
-
195
-
196
-
197
-
198
-
199
-
200
-
201
-
202
-
203
-
204
-
205
-
206
-
207
-
208
-
209
-
210
-
211
-
212
-
213
-
214
-
215
-
 216
216 -
 217
217 -
 218
218 -
 219
219 -
 220
220 -
 221
221 -
 222
222 -
 223
223 -
 224
224 -
 225
225 -
 226
226 -
 227
227 -
 228
228 -
 229
229 -
 230
230 -
 231
231 -
 232
232 -
 233
233 -
 234
234 -
 235
235 -
 236
236 -
237
-
238
-
239
-
240
-
241
-
242
-
243
-
244
-
245
-
246
-
247
-
248
-
249
-
250
-
251
-
252
-
253
-
254
-
255
-
256
-
257
-
258
-
259
-
260
-
261
-
262
-
263
-
264
-
265
-
266
-
267
-
268
-
269
-
270
-
271
-
272
-
273
-
274
-
275
-
276
-
277
-
278
-
279
-
280
-
281
-
282
-
283
-
284
-
285
-
286
-
287
-
288
-
289
-
290
-
291
-
292
-
293
-
294
-
295
-
296
-
297
-
298
-
299
-
300
-
301
-
302
-
303
-
304
-
305
-
306
-
307
-
308
-
309
-
310
-
311
-
312
-
313
-
314
-
315
-
316
-
317
-
318
-
319
-
320
-
321
-
322
-
323
-
324
-
325
-
326
-
327
 |
 |

209
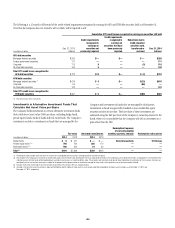
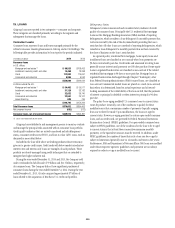
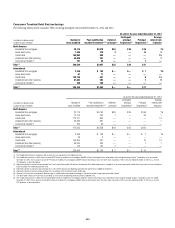
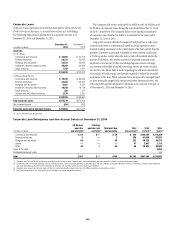
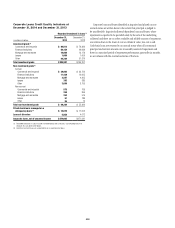
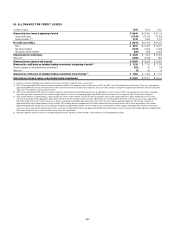
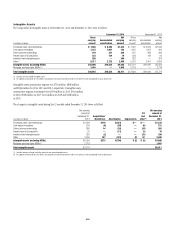
The following tables present non-accrual loan information by corporate loan type at December 31, 2014 and December 31, 2013 and interest income recognized
on non-accrual corporate loans for the years ended December 31, 2014 and 2013, respectively:
Non-Accrual Corporate Loans
At and for the year ended December 31, 2014
In millions of dollars
Recorded
investment (1)
Unpaid
principal balance
Related specific
allowance
Average
carrying value (2)
Interest income
recognized (3)
Non-accrual corporate loans
Commercial and industrial $ 575 $ 863 $155 $ 658 $32
Financial institutions 250 262 7 278 4
Mortgage and real estate 252 287 24 263 8
Lease financing 51 53 29 85 —
Other 55 68 21 60 3
Total non-accrual corporate loans $1,183 $1,533 $236 $1,344 $47
At and for the year ended December 31, 2013
In millions of dollars
Recorded
investment (1)
Unpaid
principal balance
Related specific
allowance
Average
carrying value (2)
Interest income
recognized (3)
Non-accrual corporate loans
Commercial and industrial $ 769 $1,074 $ 79 $ 967 $30
Financial institutions 365 382 3 378 9
Mortgage and real estate 515 651 35 585 3
Lease financing 189 190 131 189 —
Other 70 216 20 64 1
Total non-accrual corporate loans $ 1,908 $2,513 $268 $2,183 $ 43
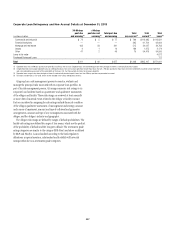
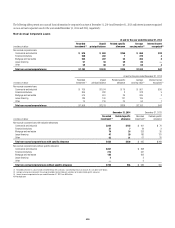
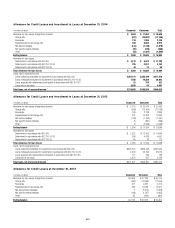
December 31, 2014 December 31, 2013
In millions of dollars
Recorded
investment (1)
Related specific
allowance
Recorded
investment (1)
Related specific
allowance
Non-accrual corporate loans with valuation allowances
Commercial and industrial $ 224 $155 $ 401 $ 79
Financial institutions 37 7 24 3
Mortgage and real estate 70 24 253 35
Lease financing 47 29 186 131
Other 55 21 61 20
Total non-accrual corporate loans with specific allowance $ 433 $236 $ 925 $268
Non-accrual corporate loans without specific allowance
Commercial and industrial $ 351 $ 368
Financial institutions 213 341
Mortgage and real estate 182 262
Lease financing 43
Other —9
Total non-accrual corporate loans without specific allowance $ 750 N/A $ 983 N/A
(1) Recorded investment in a loan includes net deferred loan fees and costs, unamortized premium or discount, less any direct write-downs.
(2) Average carrying value represents the average recorded investment balance and does not include related specific allowance.
(3) Interest income recognized for the year ended December 31, 2012 was $98 million.
N/A Not Applicable