Citibank 2014 Annual Report Download - page 193
Download and view the complete annual report
Please find page 193 of the 2014 Citibank annual report below. You can navigate through the pages in the report by either clicking on the pages listed below, or by using the keyword search tool below to find specific information within the annual report.-
 1
1 -
2
-
3
-
4
-
5
-
6
-
7
-
8
-
9
-
10
-
11
-
12
-
13
-
14
-
15
-
16
-
17
-
18
-
19
-
20
-
21
-
22
-
23
-
24
-
25
-
26
-
27
-
28
-
29
-
30
-
31
-
32
-
33
-
34
-
35
-
36
-
37
-
38
-
39
-
40
-
41
-
42
-
43
-
44
-
45
-
46
-
47
-
48
-
49
-
50
-
51
-
52
-
53
-
54
-
55
-
56
-
57
-
58
-
59
-
60
-
61
-
62
-
63
-
64
-
65
-
66
-
67
-
68
-
69
-
70
-
71
-
72
-
73
-
74
-
75
-
76
-
77
-
78
-
79
-
80
-
81
-
82
-
83
-
84
-
85
-
86
-
87
-
88
-
89
-
90
-
91
-
92
-
93
-
94
-
95
-
96
-
97
-
98
-
99
-
100
-
101
-
102
-
103
-
104
-
105
-
106
-
107
-
108
-
109
-
110
-
111
-
112
-
113
-
114
-
115
-
116
-
117
-
118
-
119
-
120
-
121
-
122
-
123
-
124
-
125
-
126
-
127
-
128
-
129
-
130
-
131
-
132
-
133
-
134
-
135
-
136
-
137
-
138
-
139
-
140
-
141
-
142
-
143
-
144
-
145
-
146
-
147
-
148
-
149
-
150
-
151
-
152
-
153
-
154
-
155
-
156
-
157
-
158
-
159
-
160
-
161
-
162
-
163
-
164
-
165
-
166
-
167
-
168
-
169
-
170
-
171
-
172
-
173
-
174
-
175
-
176
-
177
-
178
-
179
-
180
-
181
-
182
-
 183
183 -
 184
184 -
 185
185 -
 186
186 -
 187
187 -
 188
188 -
 189
189 -
 190
190 -
 191
191 -
 192
192 -
 193
193 -
 194
194 -
 195
195 -
 196
196 -
 197
197 -
 198
198 -
 199
199 -
 200
200 -
 201
201 -
 202
202 -
 203
203 -
204
-
205
-
206
-
207
-
208
-
209
-
210
-
211
-
212
-
213
-
214
-
215
-
216
-
217
-
218
-
219
-
220
-
221
-
222
-
223
-
224
-
225
-
226
-
227
-
228
-
229
-
230
-
231
-
232
-
233
-
234
-
235
-
236
-
237
-
238
-
239
-
240
-
241
-
242
-
243
-
244
-
245
-
246
-
247
-
248
-
249
-
250
-
251
-
252
-
253
-
254
-
255
-
256
-
257
-
258
-
259
-
260
-
261
-
262
-
263
-
264
-
265
-
266
-
267
-
268
-
269
-
270
-
271
-
272
-
273
-
274
-
275
-
276
-
277
-
278
-
279
-
280
-
281
-
282
-
283
-
284
-
285
-
286
-
287
-
288
-
289
-
290
-
291
-
292
-
293
-
294
-
295
-
296
-
297
-
298
-
299
-
300
-
301
-
302
-
303
-
304
-
305
-
306
-
307
-
308
-
309
-
310
-
311
-
312
-
313
-
314
-
315
-
316
-
317
-
318
-
319
-
320
-
321
-
322
-
323
-
324
-
325
-
326
-
327
 |
 |

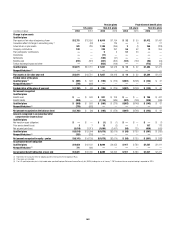
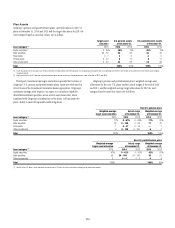
176
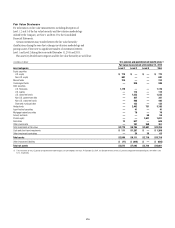
In millions of dollars Non-U.S. pension and postretirement benefit plans
Fair value measurement at December 31, 2014
Asset categories Level 1 Level 2 Level 3 Total
Equity securities
U.S. equity $ 6 $ 15 $ — $ 21
Non-U.S. equity 86 271 45 402
Mutual funds 207 3,334 — 3,541
Commingled funds 10 25 — 35
Debt securities
U.S. corporate bonds — 357 — 357
Non-U.S. government debt 3,293 246 1 3,540
Non-U.S. corporate bonds 103 811 5 919
Hedge funds — — 10 10
Mortgage-backed securities — 1 — 1
Annuity contracts — 1 32 33
Derivatives 11 — — 11
Other investments 7 13 163 183
Total investments at fair value $3,723 $5,074 $ 256 $ 9,053
Cash and short-term investments $ 112 $ 2 $ — $ 114
Total assets $3,835 $5,076 $ 256 $9,167
Other investment liabilities $ (3) $ (723) $ — $ (726)
Total net assets $3,832 $4,353 $ 256 $8,441
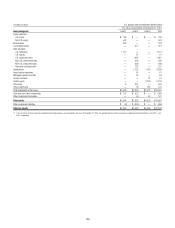
In millions of dollars Non-U.S. pension and postretirement benefit plans
Fair value measurement at December 31, 2013
Asset categories Level 1 Level 2 Level 3 Total
Equity securities
U.S. equity $ 6 $ 13 $ — $ 19
Non-U.S. equity 117 292 49 458
Mutual funds 257 3,593 — 3,850
Commingled funds 7 22 — 29
Debt securities
U.S. corporate bonds — 392 — 392
Non-U.S. government debt 2,547 232 — 2,779
Non-U.S. corporate bonds 107 780 5 892
Hedge funds — — 11 11
Mortgage-backed securities 3 1 — 4
Annuity contracts — 1 32 33
Derivatives 42 — — 42
Other investments 7 12 202 221
Total investments at fair value $3,093 $5,338 $ 299 $8,730
Cash and short-term investments $ 92 $ 4 $ — $ 96
Total assets $3,185 $ 5,342 $ 299 $ 8,826
Other investment liabilities $ — $ (436) $ — $ (436)
Total net assets $3,185 $4,906 $ 299 $ 8,390