Citibank 2014 Annual Report Download - page 30
Download and view the complete annual report
Please find page 30 of the 2014 Citibank annual report below. You can navigate through the pages in the report by either clicking on the pages listed below, or by using the keyword search tool below to find specific information within the annual report.-
 1
1 -
2
-
3
-
4
-
5
-
6
-
7
-
8
-
9
-
10
-
11
-
12
-
13
-
14
-
15
-
16
-
17
-
18
-
19
-
 20
20 -
 21
21 -
 22
22 -
 23
23 -
 24
24 -
 25
25 -
 26
26 -
 27
27 -
 28
28 -
 29
29 -
 30
30 -
 31
31 -
 32
32 -
 33
33 -
 34
34 -
 35
35 -
 36
36 -
 37
37 -
 38
38 -
 39
39 -
 40
40 -
41
-
42
-
43
-
44
-
45
-
46
-
47
-
48
-
49
-
50
-
51
-
52
-
53
-
54
-
55
-
56
-
57
-
58
-
59
-
60
-
61
-
62
-
63
-
64
-
65
-
66
-
67
-
68
-
69
-
70
-
71
-
72
-
73
-
74
-
75
-
76
-
77
-
78
-
79
-
80
-
81
-
82
-
83
-
84
-
85
-
86
-
87
-
88
-
89
-
90
-
91
-
92
-
93
-
94
-
95
-
96
-
97
-
98
-
99
-
100
-
101
-
102
-
103
-
104
-
105
-
106
-
107
-
108
-
109
-
110
-
111
-
112
-
113
-
114
-
115
-
116
-
117
-
118
-
119
-
120
-
121
-
122
-
123
-
124
-
125
-
126
-
127
-
128
-
129
-
130
-
131
-
132
-
133
-
134
-
135
-
136
-
137
-
138
-
139
-
140
-
141
-
142
-
143
-
144
-
145
-
146
-
147
-
148
-
149
-
150
-
151
-
152
-
153
-
154
-
155
-
156
-
157
-
158
-
159
-
160
-
161
-
162
-
163
-
164
-
165
-
166
-
167
-
168
-
169
-
170
-
171
-
172
-
173
-
174
-
175
-
176
-
177
-
178
-
179
-
180
-
181
-
182
-
183
-
184
-
185
-
186
-
187
-
188
-
189
-
190
-
191
-
192
-
193
-
194
-
195
-
196
-
197
-
198
-
199
-
200
-
201
-
202
-
203
-
204
-
205
-
206
-
207
-
208
-
209
-
210
-
211
-
212
-
213
-
214
-
215
-
216
-
217
-
218
-
219
-
220
-
221
-
222
-
223
-
224
-
225
-
226
-
227
-
228
-
229
-
230
-
231
-
232
-
233
-
234
-
235
-
236
-
237
-
238
-
239
-
240
-
241
-
242
-
243
-
244
-
245
-
246
-
247
-
248
-
249
-
250
-
251
-
252
-
253
-
254
-
255
-
256
-
257
-
258
-
259
-
260
-
261
-
262
-
263
-
264
-
265
-
266
-
267
-
268
-
269
-
270
-
271
-
272
-
273
-
274
-
275
-
276
-
277
-
278
-
279
-
280
-
281
-
282
-
283
-
284
-
285
-
286
-
287
-
288
-
289
-
290
-
291
-
292
-
293
-
294
-
295
-
296
-
297
-
298
-
299
-
300
-
301
-
302
-
303
-
304
-
305
-
306
-
307
-
308
-
309
-
310
-
311
-
312
-
313
-
314
-
315
-
316
-
317
-
318
-
319
-
320
-
321
-
322
-
323
-
324
-
325
-
326
-
327
 |
 |

13
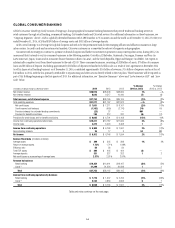
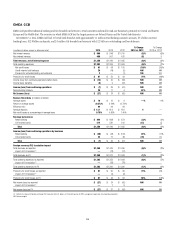
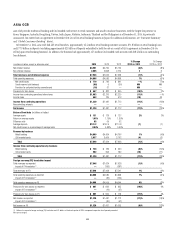
CITICORP
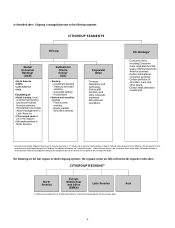
Citicorp is Citigroup’s global bank for consumers and businesses and represents Citi’s core franchises. Citicorp is focused on providing best-in-class products and
services to customers and leveraging Citigroup’s unparalleled global network, including many of the world’s emerging economies. Citicorp is physically present
in approximately 100 countries, many for over 100 years, and offers services in over 160 countries and jurisdictions. Citi believes this global network provides
a strong foundation for servicing the broad financial services needs of its large multinational clients and for meeting the needs of retail, private banking,
commercial, public sector and institutional clients around the world.
Citicorp consists of the following operating businesses: Global Consumer Banking (which consists of consumer banking in North America, EMEA, Latin
America and Asia) and Institutional Clients Group (which includes Banking and Markets and securities services). Citicorp also includes Corporate/Other.
At December 31, 2014, Citicorp had $1.7 trillion of assets and $889 billion of deposits, representing 95% of Citi’s total assets and 99% of Citi’s total
deposits, respectively.
In millions of dollars except as otherwise noted 2014 2013 2012
% Change
2014 vs. 2013
% Change
2013 vs. 2012
Net interest revenue $ 44,452 $ 43,609 $ 44,067 2% (1)%
Non-interest revenue 26,615 28,244 25,928 (6) 9
Total revenues, net of interest expense $ 71,067 $ 71,853 $ 69,995 (1)% 3%
Provisions for credit losses and for benefits and claims
Net credit losses $ 7,327 $ 7,393 $ 8,389 (1)% (12)%
Credit reserve build (release) (1,252) (826) (2,222) (52) 63
Provision for loan losses $ 6,075 $ 6,567 $ 6,167 (7)% 6%
Provision for benefits and claims 199 212 236 (6) (10)
Provision for unfunded lending commitments (152) 90 40 NM NM
Total provisions for credit losses and for benefits and claims $ 6,122 $ 6,869 $ 6,443 (11)% 7%
Total operating expenses $ 47,336 $ 42,438 $ 44,773 12% (5)%
Income from continuing operations before taxes $ 17,609 $ 22,546 $ 18,779 (22)% 20%
Income taxes 6,743 6,999 4,396 (4) 59
Income from continuing operations $ 10,866 $ 15,547 $ 14,383 (30)% 8%
Income (loss) from discontinued operations, net of taxes (2) 270 (58) NM NM
Noncontrolling interests 181 211 216 (14) (2)
Net income $ 10,683 $ 15,606 $ 14,109 (32)% 11%
Balance sheet data (in billions of dollars)
Total end-of-period (EOP) assets $ 1,745 $ 1,763 $ 1,709 (1)% 3%
Average assets 1,788 1,749 1,717 22
Return on average assets 0.60% 0.89% 0.82%
Efficiency ratio (Operating expenses/Total revenues) 67 59 64
Total EOP loans $ 572 $ 573 $ 540 —6
Total EOP deposits 889 932 863 (5) 8
NM Not meaningful