Citibank 2014 Annual Report Download - page 290
Download and view the complete annual report
Please find page 290 of the 2014 Citibank annual report below. You can navigate through the pages in the report by either clicking on the pages listed below, or by using the keyword search tool below to find specific information within the annual report.-
 1
1 -
2
-
3
-
4
-
5
-
6
-
7
-
8
-
9
-
10
-
11
-
12
-
13
-
14
-
15
-
16
-
17
-
18
-
19
-
20
-
21
-
22
-
23
-
24
-
25
-
26
-
27
-
28
-
29
-
30
-
31
-
32
-
33
-
34
-
35
-
36
-
37
-
38
-
39
-
40
-
41
-
42
-
43
-
44
-
45
-
46
-
47
-
48
-
49
-
50
-
51
-
52
-
53
-
54
-
55
-
56
-
57
-
58
-
59
-
60
-
61
-
62
-
63
-
64
-
65
-
66
-
67
-
68
-
69
-
70
-
71
-
72
-
73
-
74
-
75
-
76
-
77
-
78
-
79
-
80
-
81
-
82
-
83
-
84
-
85
-
86
-
87
-
88
-
89
-
90
-
91
-
92
-
93
-
94
-
95
-
96
-
97
-
98
-
99
-
100
-
101
-
102
-
103
-
104
-
105
-
106
-
107
-
108
-
109
-
110
-
111
-
112
-
113
-
114
-
115
-
116
-
117
-
118
-
119
-
120
-
121
-
122
-
123
-
124
-
125
-
126
-
127
-
128
-
129
-
130
-
131
-
132
-
133
-
134
-
135
-
136
-
137
-
138
-
139
-
140
-
141
-
142
-
143
-
144
-
145
-
146
-
147
-
148
-
149
-
150
-
151
-
152
-
153
-
154
-
155
-
156
-
157
-
158
-
159
-
160
-
161
-
162
-
163
-
164
-
165
-
166
-
167
-
168
-
169
-
170
-
171
-
172
-
173
-
174
-
175
-
176
-
177
-
178
-
179
-
180
-
181
-
182
-
183
-
184
-
185
-
186
-
187
-
188
-
189
-
190
-
191
-
192
-
193
-
194
-
195
-
196
-
197
-
198
-
199
-
200
-
201
-
202
-
203
-
204
-
205
-
206
-
207
-
208
-
209
-
210
-
211
-
212
-
213
-
214
-
215
-
216
-
217
-
218
-
219
-
220
-
221
-
222
-
223
-
224
-
225
-
226
-
227
-
228
-
229
-
230
-
231
-
232
-
233
-
234
-
235
-
236
-
237
-
238
-
239
-
240
-
241
-
242
-
243
-
244
-
245
-
246
-
247
-
248
-
249
-
250
-
251
-
252
-
253
-
254
-
255
-
256
-
257
-
258
-
259
-
260
-
261
-
262
-
263
-
264
-
265
-
266
-
267
-
268
-
269
-
270
-
271
-
272
-
273
-
274
-
275
-
276
-
277
-
278
-
279
-
 280
280 -
 281
281 -
 282
282 -
 283
283 -
 284
284 -
 285
285 -
 286
286 -
 287
287 -
 288
288 -
 289
289 -
 290
290 -
 291
291 -
 292
292 -
 293
293 -
 294
294 -
 295
295 -
 296
296 -
 297
297 -
 298
298 -
 299
299 -
 300
300 -
301
-
302
-
303
-
304
-
305
-
306
-
307
-
308
-
309
-
310
-
311
-
312
-
313
-
314
-
315
-
316
-
317
-
318
-
319
-
320
-
321
-
322
-
323
-
324
-
325
-
326
-
327
 |
 |

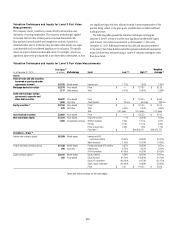
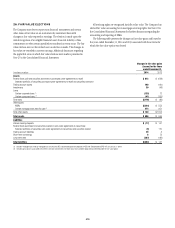
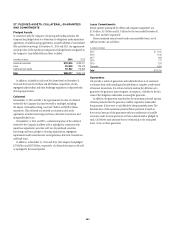
273
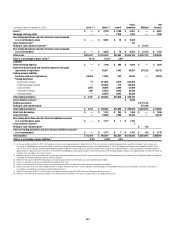
As of December 31, 2013
Fair Value
(in millions)
(1)
Methodology Input Low (2)(3) High (2)(3)
Weighted
Average (4)
Nontrading derivatives and other financial
assets and liabilities measured on a
recurring basis (gross) (6) $ 82 Price-based EBITDA multiples 5.20x 12.60x 12.08x
60 Comparables analysis PE ratio 6.90x 6.90x 6.90x
38 Model-based Price-to-book ratio 1.05x 1.05x 1.05x
Price $ — $ 105.10 $ 71.25
Fund NAV $ 1.00 $ 10,688,600 $ 9,706,488
Discount to price —% 35.00% 16.36%
Loans $2,153 Price-based Price $ — $ 103.75 $ 91.19
1,422 Model-based Yield 1.60% 4.50% 2.10%
549 Yield analysis Credit spread 49 bps 1,600 bps 302 bps
Mortgage servicing rights $2,625 Cash flow Yield 3.64% 12.00% 7.19%
WAL 2.27 years 9.44 years 6.12 years
Liabilities
Interest-bearing deposits $ 890 Model-based Equity volatility 14.79% 42.15% 27.74%
Mean reversion 1.00% 20.00% 10.50%
Equity-IR correlation 9.00% 20.50% 19.81%
Forward price 23.00% 242.00% 105.00%
Commodity correlation (75.00)% 90.00% 32.00%
Commodity volatility 4.00% 146.00% 15.00%
Federal funds purchased and
securities loaned or sold under
agreements to repurchase $ 902 Model-based Interest rate 0.47% 3.66% 2.71%
Trading account liabilities
Securities sold, not yet purchased $ 289 Model-based Credit spread 166 bps 180 bps 175 bps
$ 273 Price-based Credit-IR correlation (68.00)% 5.00% (50.00)%
Price $ — $ 124.25 $ 99.75
Short-term borrowings and
long-term debt $6,781 Model-based IR lognormal volatility 10.60% 87.20% 20.97%
868 Price-based Equity forward 79.10% 141.00% 99.51%
Equity volatility 10.70% 57.20% 19.41%
Equity-FX correlation (70.00)% 55.00% 0.60%
Equity-equity correlation (81.30)% 99.40% 48.30%
Interest rate 4.00% 10.00% 5.00%
Price $ 0.63 $ 103.75 $ 80.73
Forward price 23.00% 242.00% 101.00%
(1) The fair value amounts presented in this table represent the primary valuation technique or techniques for each class of assets or liabilities.
(2) Some inputs are shown as zero due to rounding.
(3) When the low and high inputs are the same, there is either a constant input applied to all positions, or the methodology involving the input applies to one large position only.
(4) Weighted averages are calculated based on the fair value of the instrument.
(5) For equity securities, the price and fund NAV inputs are expressed on an absolute basis, not as a percentage of the notional amount.
(6) Both trading and nontrading account derivatives—assets and liabilities—are presented on a gross absolute value basis.
(7) Includes hybrid products.