Citibank 2014 Annual Report Download - page 124
Download and view the complete annual report
Please find page 124 of the 2014 Citibank annual report below. You can navigate through the pages in the report by either clicking on the pages listed below, or by using the keyword search tool below to find specific information within the annual report.-
 1
1 -
2
-
3
-
4
-
5
-
6
-
7
-
8
-
9
-
10
-
11
-
12
-
13
-
14
-
15
-
16
-
17
-
18
-
19
-
20
-
21
-
22
-
23
-
24
-
25
-
26
-
27
-
28
-
29
-
30
-
31
-
32
-
33
-
34
-
35
-
36
-
37
-
38
-
39
-
40
-
41
-
42
-
43
-
44
-
45
-
46
-
47
-
48
-
49
-
50
-
51
-
52
-
53
-
54
-
55
-
56
-
57
-
58
-
59
-
60
-
61
-
62
-
63
-
64
-
65
-
66
-
67
-
68
-
69
-
70
-
71
-
72
-
73
-
74
-
75
-
76
-
77
-
78
-
79
-
80
-
81
-
82
-
83
-
84
-
85
-
86
-
87
-
88
-
89
-
90
-
91
-
92
-
93
-
94
-
95
-
96
-
97
-
98
-
99
-
100
-
101
-
102
-
103
-
104
-
105
-
106
-
107
-
108
-
109
-
110
-
111
-
112
-
113
-
 114
114 -
 115
115 -
 116
116 -
 117
117 -
 118
118 -
 119
119 -
 120
120 -
 121
121 -
 122
122 -
 123
123 -
 124
124 -
 125
125 -
 126
126 -
 127
127 -
 128
128 -
 129
129 -
 130
130 -
 131
131 -
 132
132 -
 133
133 -
 134
134 -
135
-
136
-
137
-
138
-
139
-
140
-
141
-
142
-
143
-
144
-
145
-
146
-
147
-
148
-
149
-
150
-
151
-
152
-
153
-
154
-
155
-
156
-
157
-
158
-
159
-
160
-
161
-
162
-
163
-
164
-
165
-
166
-
167
-
168
-
169
-
170
-
171
-
172
-
173
-
174
-
175
-
176
-
177
-
178
-
179
-
180
-
181
-
182
-
183
-
184
-
185
-
186
-
187
-
188
-
189
-
190
-
191
-
192
-
193
-
194
-
195
-
196
-
197
-
198
-
199
-
200
-
201
-
202
-
203
-
204
-
205
-
206
-
207
-
208
-
209
-
210
-
211
-
212
-
213
-
214
-
215
-
216
-
217
-
218
-
219
-
220
-
221
-
222
-
223
-
224
-
225
-
226
-
227
-
228
-
229
-
230
-
231
-
232
-
233
-
234
-
235
-
236
-
237
-
238
-
239
-
240
-
241
-
242
-
243
-
244
-
245
-
246
-
247
-
248
-
249
-
250
-
251
-
252
-
253
-
254
-
255
-
256
-
257
-
258
-
259
-
260
-
261
-
262
-
263
-
264
-
265
-
266
-
267
-
268
-
269
-
270
-
271
-
272
-
273
-
274
-
275
-
276
-
277
-
278
-
279
-
280
-
281
-
282
-
283
-
284
-
285
-
286
-
287
-
288
-
289
-
290
-
291
-
292
-
293
-
294
-
295
-
296
-
297
-
298
-
299
-
300
-
301
-
302
-
303
-
304
-
305
-
306
-
307
-
308
-
309
-
310
-
311
-
312
-
313
-
314
-
315
-
316
-
317
-
318
-
319
-
320
-
321
-
322
-
323
-
324
-
325
-
326
-
327
 |
 |

107
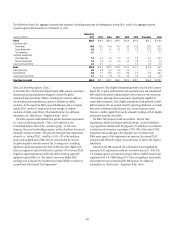
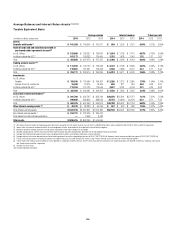
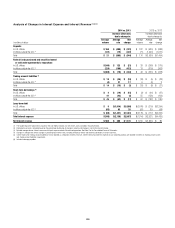
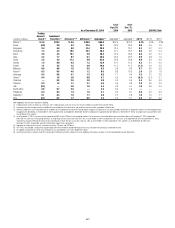
Average Balances and Interest Rates—Liabilities and Equity,
and Net Interest Revenue (1)(2)(3)(4)
Taxable Equivalent Basis
Average volume Interest expense % Average rate
In millions of dollars, except rates 2014 2013 2012 2014 2013 2012 2014 2013 2012
Liabilities
Deposits
In U.S. offices (5) $ 289,669 $ 262,544 $ 233,100 $ 1,432 $ 1,754 $ 2,137 0.49% 0.67% 0.92%
In offices outside the U.S. (6) 465,144 481,134 487,437 4,260 4,482 5,553 0.92 0.93 1.14
Total $ 754,813 $ 743,678 $ 720,537 $ 5,692 $ 6,236 $ 7,690 0.75% 0.84% 1.07%
Federal funds purchased and securities loaned
or sold under agreements to repurchase (7)
In U.S. offices $ 102,246 $ 126,742 $ 121,843 $ 656 $ 677 $ 852 0.64% 0.53% 0.70%
In offices outside the U.S. (6) 87,777 102,623 101,928 1,239 1,662 1,965 1.41 1.62 1.93
Total $ 190,023 $ 229,365 $ 223,771 $ 1,895 $ 2,339 $ 2,817 1.00% 1.02% 1.26%
Trading account liabilities (8)(9)
In U.S. offices $ 30,451 $ 24,834 $ 29,486 $ 75 $ 93 $ 116 0.25% 0.37% 0.39%
In offices outside the U.S. (6) 45,205 47,908 44,639 93 76 74 0.21 0.16 0.17
Total $ 75,656 $ 72,742 $ 74,125 $ 168 $ 169 $ 190 0.22% 0.23% 0.26%
Short-term borrowings (10)
In U.S. offices $ 79,028 $ 77,439 $ 78,747 $ 161 $ 176 $ 203 0.20% 0.23% 0.26%
In offices outside the U.S. (6) 39,220 35,551 31,897 419 421 524 1.07 1.18 1.64
Total $ 118,248 $ 112,990 $ 110,644 $ 580 $ 597 $ 727 0.49% 0.53% 0.66%
Long-term debt (11)
In U.S. offices $ 194,295 $ 194,140 $ 255,093 $ 5,093 $ 6,602 $ 8,896 2.62% 3.40% 3.49%
In offices outside the U.S. (6) 7,761 10,194 14,603 262 234 292 3.38 2.30 2.00
Total $ 202,056 $ 204,334 $ 269,696 $ 5,355 $ 6,836 $ 9,188 2.65% 3.35% 3.41%
Total interest-bearing liabilities $1,340,796 $1,363,109 $1,398,773 $13,690 $16,177 $20,612 1.02% 1.19% 1.47%
Demand deposits in U.S. offices $ 26,216 $ 21,948 $ 13,170
Other non-interest-bearing liabilities (8) 317,351 299,052 311,529
Total liabilities from discontinued operations —362 729
Total liabilities $1,684,363 $1,684,471 $1,724,201
Citigroup stockholders’ equity (12) $ 210,863 $ 196,884 $ 184,592
Noncontrolling interest 1,689 1,941 1,906
Total equity (12) $ 212,552 $ 198,825 $ 186,498
Total liabilities and stockholders’ equity $1,896,915 $1,883,296 $1,910,699
Net interest revenue as a percentage of average
interest-earning assets (13)
In U.S. offices $ 953,394 $ 926,291 $ 941,367 $27,497 $25,591 $24,586 2.88% 2.76% 2.61%
In offices outside the U.S. (6) 718,800 731,570 731,463 20,993 21,723 22,642 2.92 2.97 3.10
Total $1,672,194 $1,657,861 $1,672,830 $48,490 $47,314 $47,228 2.90% 2.85% 2.82%
(1) Net interest revenue includes the taxable equivalent adjustments (based on the U.S. federal statutory tax rate of 35%) of $498 million, $521 million and $542 million for 2014, 2013 and 2012, respectively.
(2) Interest rates and amounts include the effects of risk management activities associated with the respective asset and liability categories.
(3) Monthly or quarterly averages have been used by certain subsidiaries where daily averages are unavailable.
(4) Detailed average volume, Interest revenue and Interest expense exclude Discontinued operations. See Note 2 to the Consolidated Financial Statements.
(5) Consists of other time deposits and savings deposits. Savings deposits are made up of insured money market accounts, NOW accounts, and other savings deposits. The interest expense on savings deposits includes
FDIC deposit insurance fees and charges.
(6) Average rates reflect prevailing local interest rates, including inflationary effects and monetary corrections in certain countries.
(7) Average volumes of securities sold under agreements to repurchase are reported net pursuant to FIN 41 (ASC 210-20-45). However, Interest expense excludes the impact of FIN 41 (ASC 210-20-45).
(8) The fair value carrying amounts of derivative contracts are reported net, pursuant to FIN 39 (ASC 815-10-45), in Non-interest-earning assets and Other non-interest-bearing liabilities.
(9) Interest expense on Trading account liabilities of ICG is reported as a reduction of Interest revenue. Interest revenue and Interest expense on cash collateral positions are reported in interest on Trading account assets
and Trading account liabilities, respectively.
(10) Includes brokerage payables.
(11) Excludes hybrid financial instruments and beneficial interests in consolidated VIEs that are classified as Long-term debt, as these obligations are accounted for in changes in fair value recorded in Principal transactions.
(12) Includes stockholders’ equity from discontinued operations.
(13) Includes allocations for capital and funding costs based on the location of the asset.