Citibank 2014 Annual Report Download - page 236
Download and view the complete annual report
Please find page 236 of the 2014 Citibank annual report below. You can navigate through the pages in the report by either clicking on the pages listed below, or by using the keyword search tool below to find specific information within the annual report.-
 1
1 -
2
-
3
-
4
-
5
-
6
-
7
-
8
-
9
-
10
-
11
-
12
-
13
-
14
-
15
-
16
-
17
-
18
-
19
-
20
-
21
-
22
-
23
-
24
-
25
-
26
-
27
-
28
-
29
-
30
-
31
-
32
-
33
-
34
-
35
-
36
-
37
-
38
-
39
-
40
-
41
-
42
-
43
-
44
-
45
-
46
-
47
-
48
-
49
-
50
-
51
-
52
-
53
-
54
-
55
-
56
-
57
-
58
-
59
-
60
-
61
-
62
-
63
-
64
-
65
-
66
-
67
-
68
-
69
-
70
-
71
-
72
-
73
-
74
-
75
-
76
-
77
-
78
-
79
-
80
-
81
-
82
-
83
-
84
-
85
-
86
-
87
-
88
-
89
-
90
-
91
-
92
-
93
-
94
-
95
-
96
-
97
-
98
-
99
-
100
-
101
-
102
-
103
-
104
-
105
-
106
-
107
-
108
-
109
-
110
-
111
-
112
-
113
-
114
-
115
-
116
-
117
-
118
-
119
-
120
-
121
-
122
-
123
-
124
-
125
-
126
-
127
-
128
-
129
-
130
-
131
-
132
-
133
-
134
-
135
-
136
-
137
-
138
-
139
-
140
-
141
-
142
-
143
-
144
-
145
-
146
-
147
-
148
-
149
-
150
-
151
-
152
-
153
-
154
-
155
-
156
-
157
-
158
-
159
-
160
-
161
-
162
-
163
-
164
-
165
-
166
-
167
-
168
-
169
-
170
-
171
-
172
-
173
-
174
-
175
-
176
-
177
-
178
-
179
-
180
-
181
-
182
-
183
-
184
-
185
-
186
-
187
-
188
-
189
-
190
-
191
-
192
-
193
-
194
-
195
-
196
-
197
-
198
-
199
-
200
-
201
-
202
-
203
-
204
-
205
-
206
-
207
-
208
-
209
-
210
-
211
-
212
-
213
-
214
-
215
-
216
-
217
-
218
-
219
-
220
-
221
-
222
-
223
-
224
-
225
-
 226
226 -
 227
227 -
 228
228 -
 229
229 -
 230
230 -
 231
231 -
 232
232 -
 233
233 -
 234
234 -
 235
235 -
 236
236 -
 237
237 -
 238
238 -
 239
239 -
 240
240 -
 241
241 -
 242
242 -
 243
243 -
 244
244 -
 245
245 -
 246
246 -
247
-
248
-
249
-
250
-
251
-
252
-
253
-
254
-
255
-
256
-
257
-
258
-
259
-
260
-
261
-
262
-
263
-
264
-
265
-
266
-
267
-
268
-
269
-
270
-
271
-
272
-
273
-
274
-
275
-
276
-
277
-
278
-
279
-
280
-
281
-
282
-
283
-
284
-
285
-
286
-
287
-
288
-
289
-
290
-
291
-
292
-
293
-
294
-
295
-
296
-
297
-
298
-
299
-
300
-
301
-
302
-
303
-
304
-
305
-
306
-
307
-
308
-
309
-
310
-
311
-
312
-
313
-
314
-
315
-
316
-
317
-
318
-
319
-
320
-
321
-
322
-
323
-
324
-
325
-
326
-
327
 |
 |

219
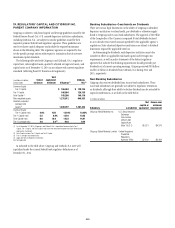
19. REGULATORY CAPITAL AND CITIGROUP INC.
PARENT COMPANY INFORMATION
Citigroup is subject to risk-based capital and leverage guidelines issued by the
Federal Reserve Board. Citi’s U.S. insured depository institution subsidiaries,
including Citibank, N.A., are subject to similar guidelines issued by their
respective primary federal bank regulatory agencies. These guidelines are
used to evaluate capital adequacy and include the required minimums
shown in the following table. The regulatory agencies are required by law
to take specific prompt actions with respect to institutions that do not meet
minimum capital standards.
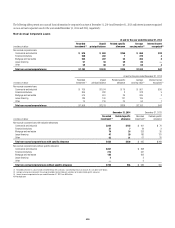
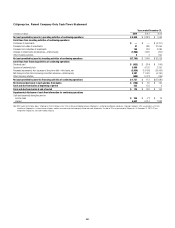
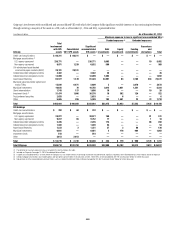
The following table sets forth Citigroup’s and Citibank, N.A.’s regulatory
capital tiers, risk-weighted assets, quarterly adjusted average total assets, and
capital ratios as of December 31, 2014 in accordance with current regulatory
standards (reflecting Basel III Transition Arrangements):
In millions of dollars,
except ratios
Stated
minimum
Well
capitalized
minimum Citigroup (1)
Citibank,
N.A.(1)
Common Equity
Tier 1 Capital $ 166,984 $ 129,135
Tier 1 Capital 166,984 129,135
Total Capital (2) 185,280 140,119
Risk-weighted assets 1,275,012 946,333
Quarterly adjusted
average total
assets (3) 1,849,297 1,367,444
Common Equity
Tier 1 Capital ratio 4.0% N/A 13.10% 13.65%
Tier 1 Capital ratio 5.5 6.0% 13.10 13.65
Total Capital ratio 8.0 10.0 14.53 14.81
Tier 1 Leverage ratio 4.0 5.0 (4) 9.03 9.44
(1) As of December 31, 2014, Citigroup’s and Citibank, N.A.’s reportable Common Equity Tier 1
Capital, Tier 1 Capital, and Total Capital ratios were the lower derived under the Basel III Advanced
Approaches framework.
(2) Total Capital includes Tier 1 Capital and Tier 2 Capital.
(3) Tier 1 Leverage ratio denominator.
(4) Applicable only to depository institutions.
N/A Not Applicable
As indicated in the table above, Citigroup and Citibank, N.A. were well
capitalized under the current federal bank regulatory definitions as of
December 31, 2014.
Banking Subsidiaries—Constraints on Dividends
There are various legal limitations on the ability of Citigroup’s subsidiary
depository institutions to extend credit, pay dividends or otherwise supply
funds to Citigroup and its non-bank subsidiaries. The approval of the Office
of the Comptroller of the Currency is required if total dividends declared
in any calendar year exceed amounts specified by the applicable agency’s
regulations. State-chartered depository institutions are subject to dividend
limitations imposed by applicable state law.
In determining the dividends, each depository institution must also
consider its effect on applicable risk-based capital and leverage ratio
requirements, as well as policy statements of the federal regulatory
agencies that indicate that banking organizations should generally pay
dividends out of current operating earnings. Citigroup received $8.9 billion
and $12.2 billion in dividends from Citibank, N.A. during 2014 and
2013, respectively.
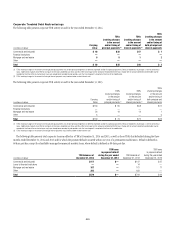
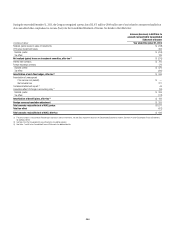
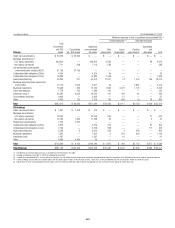
Non-Banking Subsidiaries
Citigroup also receives dividends from its non-bank subsidiaries. These
non-bank subsidiaries are generally not subject to regulatory restrictions
on dividends, although their ability to declare dividends can be restricted by
capital considerations, as set forth in the table below.
In millions of dollars
Subsidiary Jurisdiction
Net
capital or
equivalent
Excess over
minimum
requirement
Citigroup Global Markets Inc. U.S. Securities and
Exchange
Commission
Uniform Net
Capital Rule
(Rule 15c3-1) $5,521 $4,376
Citigroup Global Markets Limited United Kingdom’s
Prudential
Regulatory
Authority (PRA) $7,162 $2,482