Citibank 2014 Annual Report Download - page 112
Download and view the complete annual report
Please find page 112 of the 2014 Citibank annual report below. You can navigate through the pages in the report by either clicking on the pages listed below, or by using the keyword search tool below to find specific information within the annual report.-
 1
1 -
2
-
3
-
4
-
5
-
6
-
7
-
8
-
9
-
10
-
11
-
12
-
13
-
14
-
15
-
16
-
17
-
18
-
19
-
20
-
21
-
22
-
23
-
24
-
25
-
26
-
27
-
28
-
29
-
30
-
31
-
32
-
33
-
34
-
35
-
36
-
37
-
38
-
39
-
40
-
41
-
42
-
43
-
44
-
45
-
46
-
47
-
48
-
49
-
50
-
51
-
52
-
53
-
54
-
55
-
56
-
57
-
58
-
59
-
60
-
61
-
62
-
63
-
64
-
65
-
66
-
67
-
68
-
69
-
70
-
71
-
72
-
73
-
74
-
75
-
76
-
77
-
78
-
79
-
80
-
81
-
82
-
83
-
84
-
85
-
86
-
87
-
88
-
89
-
90
-
91
-
92
-
93
-
94
-
95
-
96
-
97
-
98
-
99
-
100
-
101
-
 102
102 -
 103
103 -
 104
104 -
 105
105 -
 106
106 -
 107
107 -
 108
108 -
 109
109 -
 110
110 -
 111
111 -
 112
112 -
 113
113 -
 114
114 -
 115
115 -
 116
116 -
 117
117 -
 118
118 -
 119
119 -
 120
120 -
 121
121 -
 122
122 -
123
-
124
-
125
-
126
-
127
-
128
-
129
-
130
-
131
-
132
-
133
-
134
-
135
-
136
-
137
-
138
-
139
-
140
-
141
-
142
-
143
-
144
-
145
-
146
-
147
-
148
-
149
-
150
-
151
-
152
-
153
-
154
-
155
-
156
-
157
-
158
-
159
-
160
-
161
-
162
-
163
-
164
-
165
-
166
-
167
-
168
-
169
-
170
-
171
-
172
-
173
-
174
-
175
-
176
-
177
-
178
-
179
-
180
-
181
-
182
-
183
-
184
-
185
-
186
-
187
-
188
-
189
-
190
-
191
-
192
-
193
-
194
-
195
-
196
-
197
-
198
-
199
-
200
-
201
-
202
-
203
-
204
-
205
-
206
-
207
-
208
-
209
-
210
-
211
-
212
-
213
-
214
-
215
-
216
-
217
-
218
-
219
-
220
-
221
-
222
-
223
-
224
-
225
-
226
-
227
-
228
-
229
-
230
-
231
-
232
-
233
-
234
-
235
-
236
-
237
-
238
-
239
-
240
-
241
-
242
-
243
-
244
-
245
-
246
-
247
-
248
-
249
-
250
-
251
-
252
-
253
-
254
-
255
-
256
-
257
-
258
-
259
-
260
-
261
-
262
-
263
-
264
-
265
-
266
-
267
-
268
-
269
-
270
-
271
-
272
-
273
-
274
-
275
-
276
-
277
-
278
-
279
-
280
-
281
-
282
-
283
-
284
-
285
-
286
-
287
-
288
-
289
-
290
-
291
-
292
-
293
-
294
-
295
-
296
-
297
-
298
-
299
-
300
-
301
-
302
-
303
-
304
-
305
-
306
-
307
-
308
-
309
-
310
-
311
-
312
-
313
-
314
-
315
-
316
-
317
-
318
-
319
-
320
-
321
-
322
-
323
-
324
-
325
-
326
-
327
 |
 |

95
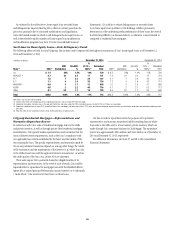
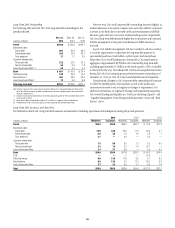
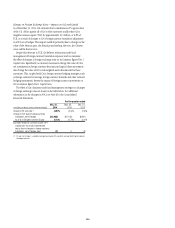
Deposits
Deposits are the primary and lowest cost funding source for Citi’s bank
subsidiaries. The table below sets forth the end-of-period deposits, by
business and/or segment, and the total average deposits for each of the
periods indicated.
In billions of dollars
Dec. 31,
2014
Sept. 30,
2014
Dec. 31,
2013
Global Consumer Banking
North America $171.4 $171.7 $170.2
EMEA 12.8 13.0 13.1
Latin America 45.5 45.9 47.4
Asia (1) 77.9 101.3 101.4
Total $307.6 $331.9 $332.1
ICG
Treasury and trade solutions (TTS) $378.6 $381.1 $379.8
Banking ex-TTS 85.9 91.0 97.4
Markets and securities services 94.4 95.3 96.9
Total $558.9 $567.4 $574.1
Corporate/Other 22.8 29.0 26.1
Total Citicorp $889.3 $928.3 $932.3
Total Citi Holdings (2) 10.0 14.4 36.0
Total Citigroup deposits (EOP) $899.3 $942.7 $968.3
Total Citigroup deposits (AVG) $938.7 $954.2 $956.4
(1) December 31, 2014 deposit balance reflects the reclassification to held-for-sale of approximately
$21 billion of deposits as a result of Citigroup’s entry into an agreement in December 2014 to sell its
Japan retail banking business.
(2) Included within Citi Holding’s end-of-period deposit balance as of December 31, 2014 was
approximately $9 billion of deposits related to Morgan Stanley Smith Barney (MSSB) customers that,
as previously disclosed, will be transferred to Morgan Stanley by MSSB, with remaining balances
transferred in the amount of approximately $5 billion per quarter through the end of the second
quarter of 2015.
End-of-period deposits decreased 7% year-over-year and 5% quarter-
over-quarter, each primarily due to the reclassification to held-for-sale of
approximately $21 billion of deposits as a result of Citigroup’s entry into an
agreement in December 2014 to sell its Japan retail banking business, as well
as the impact of FX translation.
Excluding these items, Citigroup deposits declined 2% year-over-year,
as 1% growth in Citicorp deposits was more than offset by the continued
decline in Citi Holdings due to the ongoing transfer of MSSB deposits to
Morgan Stanley. Within Citicorp, GCB deposits increased 2% year-over-year,
with growth in all four regions. North America GCB deposits increased
1% year-over-year, with a continued focus on growing checking account
balances, and international deposits grew 3% year-over-year. ICG deposits
increased 1% year-over-year, with 3% growth in treasury and trade solutions
balances, partially offset by reductions in markets-related businesses. Average
deposits were relatively unchanged year-over-year and quarter-over-quarter,
as growth in Citicorp was offset by the ongoing transfer of MSSB deposits to
Morgan Stanley.
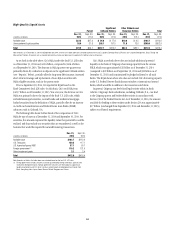
Citi monitors its deposit base across multiple dimensions, including what
Citi refers to as “LCR value” or the liquidity value of the deposit base under
the LCR rules. Under LCR rules, deposits are assigned liquidity values based
on expected behavior under stress, the type of deposit and the type of client.
Generally, the final U.S. LCR rules prioritize operating accounts of consumers
(including retail and commercial banking deposits) and corporations, while
assigning lower liquidity values to non-operating balances of financial
institutions. Citi estimates that as of December 31, 2014, its total deposits had
a liquidity value of approximately 73% under the LCR rules, up from 72% as
of September 30, 2014 and 71% as of December 31, 2013, with the gradual
increase primarily driven by reductions in lower LCR value deposits.
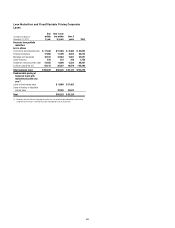
Long-Term Debt
Long-term debt (generally defined as debt with original maturities of one
year or more) represents the most significant component of Citi’s funding
for the parent entities and is a supplementary source of funding for the
bank entities.
Long-term debt is an important funding source due in part to its multi-
year maturity structure. The weighted-average maturities of unsecured
long-term debt issued by Citigroup and its affiliates (including Citibank,
N.A.) with a remaining life greater than one year (excluding remaining
trust preferred securities outstanding) was approximately 6.9 years as of
December 31, 2014, largely unchanged from the prior quarter and year. Citi
believes this term structure enables it to meet its business needs and maintain
adequate liquidity.
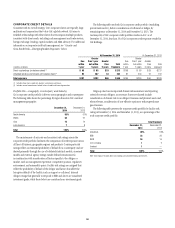
Citi’s long-term debt outstanding at the parent includes benchmark debt
and what Citi refers to as customer-related debt, consisting of structured
notes, such as equity- and credit-linked notes, as well as non-structured
notes. Citi’s issuance of customer-related debt is generally driven by customer
demand and supplements benchmark debt issuance as a source of funding
for Citi’s parent entities. Citi’s long-term debt at the bank includes FHLB
advances and securitizations.