Citibank 2014 Annual Report Download - page 128
Download and view the complete annual report
Please find page 128 of the 2014 Citibank annual report below. You can navigate through the pages in the report by either clicking on the pages listed below, or by using the keyword search tool below to find specific information within the annual report.-
 1
1 -
2
-
3
-
4
-
5
-
6
-
7
-
8
-
9
-
10
-
11
-
12
-
13
-
14
-
15
-
16
-
17
-
18
-
19
-
20
-
21
-
22
-
23
-
24
-
25
-
26
-
27
-
28
-
29
-
30
-
31
-
32
-
33
-
34
-
35
-
36
-
37
-
38
-
39
-
40
-
41
-
42
-
43
-
44
-
45
-
46
-
47
-
48
-
49
-
50
-
51
-
52
-
53
-
54
-
55
-
56
-
57
-
58
-
59
-
60
-
61
-
62
-
63
-
64
-
65
-
66
-
67
-
68
-
69
-
70
-
71
-
72
-
73
-
74
-
75
-
76
-
77
-
78
-
79
-
80
-
81
-
82
-
83
-
84
-
85
-
86
-
87
-
88
-
89
-
90
-
91
-
92
-
93
-
94
-
95
-
96
-
97
-
98
-
99
-
100
-
101
-
102
-
103
-
104
-
105
-
106
-
107
-
108
-
109
-
110
-
111
-
112
-
113
-
114
-
115
-
116
-
117
-
 118
118 -
 119
119 -
 120
120 -
 121
121 -
 122
122 -
 123
123 -
 124
124 -
 125
125 -
 126
126 -
 127
127 -
 128
128 -
 129
129 -
 130
130 -
 131
131 -
 132
132 -
 133
133 -
 134
134 -
 135
135 -
 136
136 -
 137
137 -
 138
138 -
139
-
140
-
141
-
142
-
143
-
144
-
145
-
146
-
147
-
148
-
149
-
150
-
151
-
152
-
153
-
154
-
155
-
156
-
157
-
158
-
159
-
160
-
161
-
162
-
163
-
164
-
165
-
166
-
167
-
168
-
169
-
170
-
171
-
172
-
173
-
174
-
175
-
176
-
177
-
178
-
179
-
180
-
181
-
182
-
183
-
184
-
185
-
186
-
187
-
188
-
189
-
190
-
191
-
192
-
193
-
194
-
195
-
196
-
197
-
198
-
199
-
200
-
201
-
202
-
203
-
204
-
205
-
206
-
207
-
208
-
209
-
210
-
211
-
212
-
213
-
214
-
215
-
216
-
217
-
218
-
219
-
220
-
221
-
222
-
223
-
224
-
225
-
226
-
227
-
228
-
229
-
230
-
231
-
232
-
233
-
234
-
235
-
236
-
237
-
238
-
239
-
240
-
241
-
242
-
243
-
244
-
245
-
246
-
247
-
248
-
249
-
250
-
251
-
252
-
253
-
254
-
255
-
256
-
257
-
258
-
259
-
260
-
261
-
262
-
263
-
264
-
265
-
266
-
267
-
268
-
269
-
270
-
271
-
272
-
273
-
274
-
275
-
276
-
277
-
278
-
279
-
280
-
281
-
282
-
283
-
284
-
285
-
286
-
287
-
288
-
289
-
290
-
291
-
292
-
293
-
294
-
295
-
296
-
297
-
298
-
299
-
300
-
301
-
302
-
303
-
304
-
305
-
306
-
307
-
308
-
309
-
310
-
311
-
312
-
313
-
314
-
315
-
316
-
317
-
318
-
319
-
320
-
321
-
322
-
323
-
324
-
325
-
326
-
327
 |
 |

111
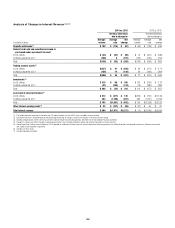
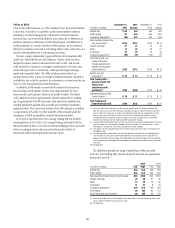
Value at Risk
Value at risk (VAR) estimates, at a 99% confidence level, the potential decline
in the value of a position or a portfolio under normal market conditions
assuming a one-day holding period. VAR statistics, which are based on
historical data, can be materially different across firms due to differences in
portfolio composition, differences in VAR methodologies, and differences in
model parameters. As a result, Citi believes VAR statistics can be used more
effectively as indicators of trends in risk taking within a firm, rather than as a
basis for inferring differences in risk-taking across firms.
Citi uses a single, independently approved Monte Carlo simulation VAR
model (see “VAR Model Review and Validation” below), which has been
designed to capture material risk sensitivities (such as first- and second-
order sensitivities of positions to changes in market prices) of various asset
classes/risk types (such as interest rate, credit spread, foreign exchange,
equity and commodity risks). Citi’s VAR includes positions which are
measured at fair value; it does not include investment securities classified as
available-for-sale or held-to-maturity. For information on these securities, see
Note 14 to the Consolidated Financial Statements.
Citi believes its VAR model is conservatively calibrated to incorporate
fat-tail scaling and the greater of short-term (approximately the most
recent month) and long-term (three years) market volatility. The Monte
Carlo simulation involves approximately 300,000 market factors, making
use of approximately 180,000 time series, with sensitivities updated daily,
volatility parameters updated daily to weekly and correlation parameters
updated monthly. The conservative features of the VAR calibration contribute
an approximate 21% add-on to what would be a VAR estimated under the
assumption of stable and perfectly, normally distributed markets.
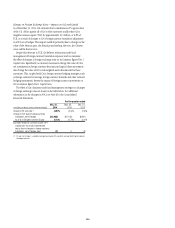
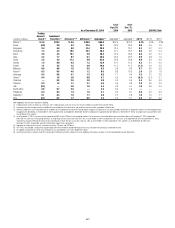
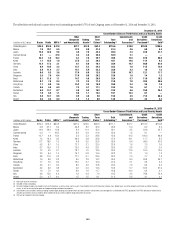
As set forth in the table below, Citi’s average Trading VAR was relatively
unchanged from 2013 to 2014. Citi’s average Trading and Credit Portfolio
VAR increased from 2013 to 2014 due to increased hedging activity associated
with non-trading positions and increased credit spread volatility of
benchmark indices resulting from idiosyncratic events.
In millions of dollars
December 31,
2014
2014
Average
December 31,
2013
2013
Average
Interest rate $ 68 N/A N/A N/A
Credit spread 87 N/A N/A N/A
Covariance adjustment (1) (36) N/A N/A N/A
Fully diversified interest rate
and credit spread $119 $114 $115 $114
Foreign exchange 27 31 34 35
Equity 17 24 26 27
Commodity 23 16 13 12
Covariance adjustment (1) (56) (73) (63) (75)
Total Trading VAR—all
market risk factors,
including general and
specific risk (excluding
credit portfolios) (2) $130 $112 $125 $113
Specific risk-only
component (3) $ 10 $ 12 $ 15 $ 14
Total Trading VAR—
general market risk
factors only
(excluding credit
portfolios) (2) $120 $100 $110 $ 99
Incremental Impact of the
Credit Portfolio (4) $ 18 $ 21 $ 19 $ 8
Total Trading and
Credit Portfolios VAR $148 $133 $144 $121
(1) Covariance adjustment (also known as diversification benefit) equals the difference between the
total VAR and the sum of the VARs tied to each individual risk type. The benefit reflects the fact that
the risks within each and across risk types are not perfectly correlated and, consequently, the total
VAR on a given day will be lower than the sum of the VARs relating to each individual risk type.
The determination of the primary drivers of changes to the covariance adjustment is made by an
examination of the impact of both model parameter and position changes.
(2) The total Trading VAR includes mark-to-market and certain fair value option trading positions from ICG
and Citi Holdings, with the exception of hedges to the loan portfolio, fair value option loans, and all
CVA exposures. Available-for-sale and accrual exposures are not included.
(3) The specific risk-only component represents the level of equity and fixed income issuer-specific risk
embedded in VAR.
(4) The credit portfolio is composed of mark-to-market positions associated with non-trading business
units including Citi Treasury, the CVA relating to derivative counterparties and all associated CVA
hedges. FVA and DVA are not included. The credit portfolio also includes hedges to the loan portfolio,
fair value option loans and hedges to the leveraged finance pipeline within capital markets origination
within ICG.
N/A Not applicable
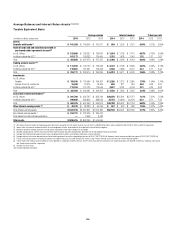
The table below provides the range of market factor VARs associated
with Citi’s Total Trading VAR, inclusive of specific risk, that was experienced
during 2014 and 2013:
2014 2013
In millions of dollars Low High Low High
Interest rate N/A N/A N/A N/A
Credit spread N/A N/A N/A N/A
Fully diversified interest rate and credit spread $84 $158 $92 $142
Foreign exchange 20 59 21 66
Equity 14 48 18 60
Commodity 11 27 8 24
Covariance adjustment (1) N/A N/A N/A N/A
Total Trading 84 163 85 151
Total Trading and Credit Portfolio 96 188 93 175
(1) No covariance adjustment can be inferred from the above table as the high and low for each market
factor will be from different close of business dates.
N/A Not applicable