Citibank 2014 Annual Report Download - page 246
Download and view the complete annual report
Please find page 246 of the 2014 Citibank annual report below. You can navigate through the pages in the report by either clicking on the pages listed below, or by using the keyword search tool below to find specific information within the annual report.-
 1
1 -
2
-
3
-
4
-
5
-
6
-
7
-
8
-
9
-
10
-
11
-
12
-
13
-
14
-
15
-
16
-
17
-
18
-
19
-
20
-
21
-
22
-
23
-
24
-
25
-
26
-
27
-
28
-
29
-
30
-
31
-
32
-
33
-
34
-
35
-
36
-
37
-
38
-
39
-
40
-
41
-
42
-
43
-
44
-
45
-
46
-
47
-
48
-
49
-
50
-
51
-
52
-
53
-
54
-
55
-
56
-
57
-
58
-
59
-
60
-
61
-
62
-
63
-
64
-
65
-
66
-
67
-
68
-
69
-
70
-
71
-
72
-
73
-
74
-
75
-
76
-
77
-
78
-
79
-
80
-
81
-
82
-
83
-
84
-
85
-
86
-
87
-
88
-
89
-
90
-
91
-
92
-
93
-
94
-
95
-
96
-
97
-
98
-
99
-
100
-
101
-
102
-
103
-
104
-
105
-
106
-
107
-
108
-
109
-
110
-
111
-
112
-
113
-
114
-
115
-
116
-
117
-
118
-
119
-
120
-
121
-
122
-
123
-
124
-
125
-
126
-
127
-
128
-
129
-
130
-
131
-
132
-
133
-
134
-
135
-
136
-
137
-
138
-
139
-
140
-
141
-
142
-
143
-
144
-
145
-
146
-
147
-
148
-
149
-
150
-
151
-
152
-
153
-
154
-
155
-
156
-
157
-
158
-
159
-
160
-
161
-
162
-
163
-
164
-
165
-
166
-
167
-
168
-
169
-
170
-
171
-
172
-
173
-
174
-
175
-
176
-
177
-
178
-
179
-
180
-
181
-
182
-
183
-
184
-
185
-
186
-
187
-
188
-
189
-
190
-
191
-
192
-
193
-
194
-
195
-
196
-
197
-
198
-
199
-
200
-
201
-
202
-
203
-
204
-
205
-
206
-
207
-
208
-
209
-
210
-
211
-
212
-
213
-
214
-
215
-
216
-
217
-
218
-
219
-
220
-
221
-
222
-
223
-
224
-
225
-
226
-
227
-
228
-
229
-
230
-
231
-
232
-
233
-
234
-
235
-
 236
236 -
 237
237 -
 238
238 -
 239
239 -
 240
240 -
 241
241 -
 242
242 -
 243
243 -
 244
244 -
 245
245 -
 246
246 -
 247
247 -
 248
248 -
 249
249 -
 250
250 -
 251
251 -
 252
252 -
 253
253 -
 254
254 -
 255
255 -
 256
256 -
257
-
258
-
259
-
260
-
261
-
262
-
263
-
264
-
265
-
266
-
267
-
268
-
269
-
270
-
271
-
272
-
273
-
274
-
275
-
276
-
277
-
278
-
279
-
280
-
281
-
282
-
283
-
284
-
285
-
286
-
287
-
288
-
289
-
290
-
291
-
292
-
293
-
294
-
295
-
296
-
297
-
298
-
299
-
300
-
301
-
302
-
303
-
304
-
305
-
306
-
307
-
308
-
309
-
310
-
311
-
312
-
313
-
314
-
315
-
316
-
317
-
318
-
319
-
320
-
321
-
322
-
323
-
324
-
325
-
326
-
327
 |
 |

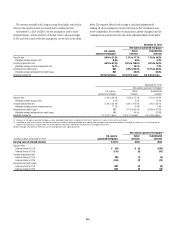
229
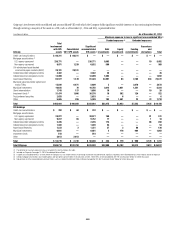
In millions of dollars As of December 31, 2013
Maximum exposure to loss in significant unconsolidated VIEs (1)
Funded exposures (2) Unfunded exposures
Citicorp
Total
involvement
with SPE
assets
Consolidated
VIE / SPE assets
Significant
unconsolidated
VIE assets (3)
Debt
investments
Equity
investments
Funding
commitments
Guarantees
and
derivatives Total
Credit card securitizations $ 52,229 $ 52,229 $ — $ — $ — $ — $ — $ —
Mortgage securitizations (4)
U.S. agency-sponsored 239,204 — 239,204 3,583 — — 36 3,619
Non-agency-sponsored 7,711 598 7,113 583 — — — 583
Citi-administered asset-backed
commercial paper conduits (ABCP) 31,759 31,759 — — — — — —
Collateralized debt obligations (CDOs) 4,204 — 4,204 34 — — — 34
Collateralized loan obligations (CLOs) 16,883 — 16,883 1,938 — — — 1,938
Asset-based financing 45,884 971 44,913 17,341 74 1,004 195 18,614
Municipal securities tender option bond
trusts (TOBs) 12,716 7,039 5,677 29 — 3,881 — 3,910
Municipal investments 15,962 223 15,739 1,846 2,073 1,173 — 5,092
Client intermediation 1,778 195 1,583 145 — — — 145
Investment funds (5) 32,324 3,094 29,230 191 264 81 — 536
Trust preferred securities 4,822 — 4,822 — 51 — — 51
Other 2,439 225 2,214 143 649 20 78 890
Total $467,915 $ 96,333 $371,582 $ 25,833 $ 3,111 $ 6,159 $ 309 $ 35,412
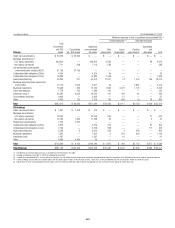
Citi Holdings
Credit card securitizations $ 1,867 $ 1,448 $ 419 $ — $ — $ — $ — $ —
Mortgage securitizations
U.S. agency-sponsored 73,549 — 73,549 549 — — 77 626
Non-agency-sponsored 13,193 1,695 11,498 35 — — 2 37
Student loan securitizations 1,520 1,520 — — — — — —
Collateralized debt obligations (CDOs) 3,879 — 3,879 273 — — 87 360
Collateralized loan obligations (CLOs) 2,733 — 2,733 358 — — 111 469
Asset-based financing 3,508 3 3,505 629 3 258 — 890
Municipal investments 7,304 — 7,304 3 204 939 — 1,146
Investment funds 1,237 — 1,237 — 61 — — 61
Other 4,494 4,434 60 — — — — —
Total $113,284 $ 9,100 $104,184 $ 1,847 $ 268 $ 1,197 $ 277 $ 3,589
Total Citigroup $581,199 $105,433 $475,766 $ 27,680 $ 3,379 $ 7,356 $ 586 $ 39,001
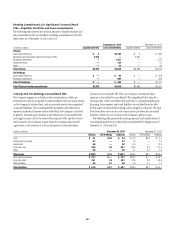
(1) The definition of maximum exposure to loss is included in the text that follows this table.
(2) Included on Citigroup’s December 31, 2013 Consolidated Balance Sheet.
(3) A significant unconsolidated VIE is an entity where the Company has any variable interest or continuing involvement considered to be significant, regardless of the likelihood of loss or the notional amount of exposure.
(4) Citicorp mortgage securitizations also include agency and non-agency (private-label) re-securitization activities. These SPEs are not consolidated. See “Re-securitizations” below for further discussion.
(5) Substantially all of the unconsolidated investment funds’ assets are related to retirement funds in Mexico managed by Citi. See “Investment Funds” below for further discussion.