Citibank 2014 Annual Report Download - page 197
Download and view the complete annual report
Please find page 197 of the 2014 Citibank annual report below. You can navigate through the pages in the report by either clicking on the pages listed below, or by using the keyword search tool below to find specific information within the annual report.-
 1
1 -
2
-
3
-
4
-
5
-
6
-
7
-
8
-
9
-
10
-
11
-
12
-
13
-
14
-
15
-
16
-
17
-
18
-
19
-
20
-
21
-
22
-
23
-
24
-
25
-
26
-
27
-
28
-
29
-
30
-
31
-
32
-
33
-
34
-
35
-
36
-
37
-
38
-
39
-
40
-
41
-
42
-
43
-
44
-
45
-
46
-
47
-
48
-
49
-
50
-
51
-
52
-
53
-
54
-
55
-
56
-
57
-
58
-
59
-
60
-
61
-
62
-
63
-
64
-
65
-
66
-
67
-
68
-
69
-
70
-
71
-
72
-
73
-
74
-
75
-
76
-
77
-
78
-
79
-
80
-
81
-
82
-
83
-
84
-
85
-
86
-
87
-
88
-
89
-
90
-
91
-
92
-
93
-
94
-
95
-
96
-
97
-
98
-
99
-
100
-
101
-
102
-
103
-
104
-
105
-
106
-
107
-
108
-
109
-
110
-
111
-
112
-
113
-
114
-
115
-
116
-
117
-
118
-
119
-
120
-
121
-
122
-
123
-
124
-
125
-
126
-
127
-
128
-
129
-
130
-
131
-
132
-
133
-
134
-
135
-
136
-
137
-
138
-
139
-
140
-
141
-
142
-
143
-
144
-
145
-
146
-
147
-
148
-
149
-
150
-
151
-
152
-
153
-
154
-
155
-
156
-
157
-
158
-
159
-
160
-
161
-
162
-
163
-
164
-
165
-
166
-
167
-
168
-
169
-
170
-
171
-
172
-
173
-
174
-
175
-
176
-
177
-
178
-
179
-
180
-
181
-
182
-
183
-
184
-
185
-
186
-
 187
187 -
 188
188 -
 189
189 -
 190
190 -
 191
191 -
 192
192 -
 193
193 -
 194
194 -
 195
195 -
 196
196 -
 197
197 -
 198
198 -
 199
199 -
 200
200 -
 201
201 -
 202
202 -
 203
203 -
 204
204 -
 205
205 -
 206
206 -
 207
207 -
208
-
209
-
210
-
211
-
212
-
213
-
214
-
215
-
216
-
217
-
218
-
219
-
220
-
221
-
222
-
223
-
224
-
225
-
226
-
227
-
228
-
229
-
230
-
231
-
232
-
233
-
234
-
235
-
236
-
237
-
238
-
239
-
240
-
241
-
242
-
243
-
244
-
245
-
246
-
247
-
248
-
249
-
250
-
251
-
252
-
253
-
254
-
255
-
256
-
257
-
258
-
259
-
260
-
261
-
262
-
263
-
264
-
265
-
266
-
267
-
268
-
269
-
270
-
271
-
272
-
273
-
274
-
275
-
276
-
277
-
278
-
279
-
280
-
281
-
282
-
283
-
284
-
285
-
286
-
287
-
288
-
289
-
290
-
291
-
292
-
293
-
294
-
295
-
296
-
297
-
298
-
299
-
300
-
301
-
302
-
303
-
304
-
305
-
306
-
307
-
308
-
309
-
310
-
311
-
312
-
313
-
314
-
315
-
316
-
317
-
318
-
319
-
320
-
321
-
322
-
323
-
324
-
325
-
326
-
327
 |
 |

180
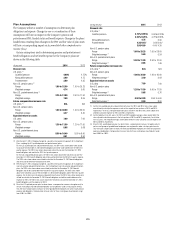
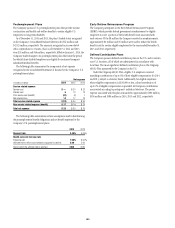
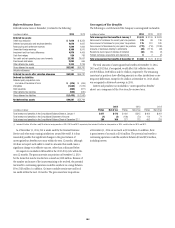
Postemployment Plans
The Company sponsors U.S. postemployment plans that provide income
continuation and health and welfare benefits to certain eligible U.S.
employees on long-term disability.
As of December 31, 2014 and 2013, the plans’ funded status recognized
in the Company’s Consolidated Balance Sheet was $(256) million and
$(252) million, respectively. The amounts recognized in Accumulated
other comprehensive income (loss) as of December 31, 2014 and 2013
were $24 million and $46 million, respectively. Effective January 1, 2014, the
Company made changes to its postemployment plans that limit the period
for which future disabled employees are eligible for continued company
subsidized medical benefits.
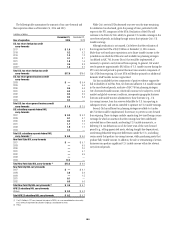
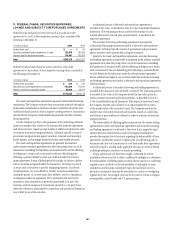
The following table summarizes the components of net expense
recognized in the Consolidated Statement of Income for the Company’s U.S.
postemployment plans.
Net expense
In millions of dollars 2014 2013 2012
Service related expense
Service cost $ — $ 20 $ 22
Interest cost 510 13
Prior service cost (benefit) (31) (3) 7
Net actuarial loss 14 17 13
Total service related expense $ (12) $ 44 $ 55
Non-service related expense (benefit) $ 37 $(14) $ 24
Total net expense $ 25 $ 30 $ 79
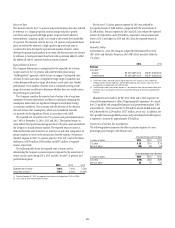
The following table summarizes certain assumptions used in determining
the postemployment benefit obligations and net benefit expenses for the
Company’s U.S. postemployment plans.
2014 2013
Discount rate 3.45% 4.05%
Health care cost increase rate
Following year 7.50% 8.00%
Ultimate rate to which cost increase is assumed to decline 5.00 5.00
Year in which the ultimate rate is reached 2020 2020
Early Retiree Reinsurance Program
The Company participates in the Early Retiree Reinsurance Program
(ERRP), which provides federal government reimbursement to eligible
employers to cover a portion of the health benefit costs associated with
early retirees. Of the $8 million the Company received in reimbursements,
approximately $3 million and $5 million were used to reduce the health
benefit costs for certain eligible employees for the years ended December 31,
2013 and 2012, respectively.
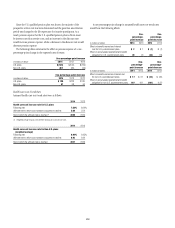
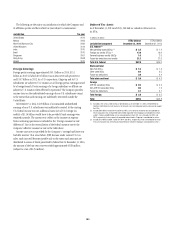
Defined Contribution Plans
The Company sponsors defined contribution plans in the U.S. and in certain
non-U.S. locations, all of which are administered in accordance with
local laws. The most significant defined contribution plan is the Citigroup
401(k) Plan sponsored by the Company in the U.S.
Under the Citigroup 401(k) Plan, eligible U.S. employees received
matching contributions of up to 6% of their eligible compensation for 2014
and 2013, subject to statutory limits. Additionally, for eligible employees
whose eligible compensation is $100,000 or less, a fixed contribution of
up to 2% of eligible compensation is provided. All Company contributions
are invested according to participants’ individual elections. The pretax
expense associated with this plan amounted to approximately $383 million,
$394 million and $384 million in 2014, 2013 and 2012, respectively.