Citibank 2014 Annual Report Download - page 113
Download and view the complete annual report
Please find page 113 of the 2014 Citibank annual report below. You can navigate through the pages in the report by either clicking on the pages listed below, or by using the keyword search tool below to find specific information within the annual report.-
 1
1 -
2
-
3
-
4
-
5
-
6
-
7
-
8
-
9
-
10
-
11
-
12
-
13
-
14
-
15
-
16
-
17
-
18
-
19
-
20
-
21
-
22
-
23
-
24
-
25
-
26
-
27
-
28
-
29
-
30
-
31
-
32
-
33
-
34
-
35
-
36
-
37
-
38
-
39
-
40
-
41
-
42
-
43
-
44
-
45
-
46
-
47
-
48
-
49
-
50
-
51
-
52
-
53
-
54
-
55
-
56
-
57
-
58
-
59
-
60
-
61
-
62
-
63
-
64
-
65
-
66
-
67
-
68
-
69
-
70
-
71
-
72
-
73
-
74
-
75
-
76
-
77
-
78
-
79
-
80
-
81
-
82
-
83
-
84
-
85
-
86
-
87
-
88
-
89
-
90
-
91
-
92
-
93
-
94
-
95
-
96
-
97
-
98
-
99
-
100
-
101
-
102
-
 103
103 -
 104
104 -
 105
105 -
 106
106 -
 107
107 -
 108
108 -
 109
109 -
 110
110 -
 111
111 -
 112
112 -
 113
113 -
 114
114 -
 115
115 -
 116
116 -
 117
117 -
 118
118 -
 119
119 -
 120
120 -
 121
121 -
 122
122 -
 123
123 -
124
-
125
-
126
-
127
-
128
-
129
-
130
-
131
-
132
-
133
-
134
-
135
-
136
-
137
-
138
-
139
-
140
-
141
-
142
-
143
-
144
-
145
-
146
-
147
-
148
-
149
-
150
-
151
-
152
-
153
-
154
-
155
-
156
-
157
-
158
-
159
-
160
-
161
-
162
-
163
-
164
-
165
-
166
-
167
-
168
-
169
-
170
-
171
-
172
-
173
-
174
-
175
-
176
-
177
-
178
-
179
-
180
-
181
-
182
-
183
-
184
-
185
-
186
-
187
-
188
-
189
-
190
-
191
-
192
-
193
-
194
-
195
-
196
-
197
-
198
-
199
-
200
-
201
-
202
-
203
-
204
-
205
-
206
-
207
-
208
-
209
-
210
-
211
-
212
-
213
-
214
-
215
-
216
-
217
-
218
-
219
-
220
-
221
-
222
-
223
-
224
-
225
-
226
-
227
-
228
-
229
-
230
-
231
-
232
-
233
-
234
-
235
-
236
-
237
-
238
-
239
-
240
-
241
-
242
-
243
-
244
-
245
-
246
-
247
-
248
-
249
-
250
-
251
-
252
-
253
-
254
-
255
-
256
-
257
-
258
-
259
-
260
-
261
-
262
-
263
-
264
-
265
-
266
-
267
-
268
-
269
-
270
-
271
-
272
-
273
-
274
-
275
-
276
-
277
-
278
-
279
-
280
-
281
-
282
-
283
-
284
-
285
-
286
-
287
-
288
-
289
-
290
-
291
-
292
-
293
-
294
-
295
-
296
-
297
-
298
-
299
-
300
-
301
-
302
-
303
-
304
-
305
-
306
-
307
-
308
-
309
-
310
-
311
-
312
-
313
-
314
-
315
-
316
-
317
-
318
-
319
-
320
-
321
-
322
-
323
-
324
-
325
-
326
-
327
 |
 |

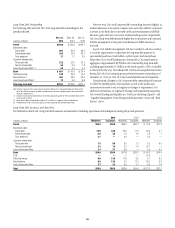
96
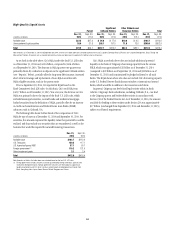
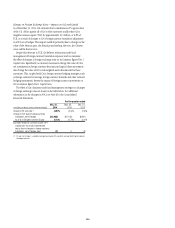
Long-Term Debt Outstanding
The following table sets forth Citi’s total long-term debt outstanding for the
periods indicated:
In billions of dollars
Dec. 31,
2014
Sept. 30,
2014
Dec. 31,
2013
Parent $158.0 $155.9 $164.7
Benchmark debt:
Senior debt 96.7 96.3 98.5
Subordinated debt 25.5 24.2 28.1
Trust preferred 1.7 1.7 3.9
Customer-Related debt:
Structured debt 22.3 22.3 22.2
Non-structured debt 5.9 6.4 7.8
Local Country and Other (1)(2) 5.9 5.0 4.2
Bank $ 65.1 $ 67.9 $ 56.4
FHLB Borrowings 19.8 23.3 14.0
Securitizations (3) 38.1 38.2 33.6
Local Country and Other (2) 7.2 6.4 8.8
Total long-term debt $223.1 $223.8 $221.1
Note: Amounts represent the current value of long-term debt on Citi’s Consolidated Balance Sheet which,
for certain debt instruments, includes consideration of fair value, hedging impacts and unamortized
discounts and premiums.
(1) Includes securitizations of $2.0 billion for the third and fourth quarter of 2014 and $0.2 billion for the
fourth quarter of 2013.
(2) Local country debt includes debt issued by Citi’s affiliates in support of their local operations.
(3) Predominantly credit card securitizations, primarily backed by Citi-branded credit cards.
Year-over-year, Citi’s total long-term debt outstanding increased slightly, as
modest reductions at the parent company were more than offset by continued
increases in the bank due to increased credit card securitizations and FHLB
advances, given the lower-cost nature of these funding sources. Sequentially,
Citi’s total long-term debt decreased slightly due to maturities and continued
liability management at the parent and decreases in FHLB advances at
the bank.
As part of its liability management, Citi has considered, and may continue
to consider, opportunities to repurchase its long-term debt pursuant to
open market purchases, tender offers or other means. Such repurchases
help reduce Citi’s overall funding costs. During 2014, Citi repurchased an
aggregate of approximately $9.8 billion of its outstanding long-term debt,
including approximately $1.5 billion in the fourth quarter of 2014. Included
in this total for the year, Citi redeemed $2.1 billion of trust preferred securities
during 2014 (for Citi’s remaining trust preferred securities outstanding as of
December 31, 2014, see Note 18 to the Consolidated Financial Statements).
Going forward, changes in Citi’s long-term debt outstanding will continue
to reflect the funding needs of its businesses as well as the market and
economic environment and any regulatory changes or requirements. For
additional information on regulatory changes and requirements impacting
Citi’s overall funding and liquidity, see “Total Loss-Absorbing Capacity” and
“Liquidity Management, Stress Testing and Measurement” below and “Risk
Factors” above.
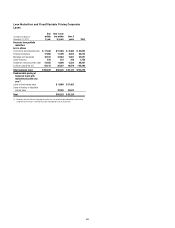
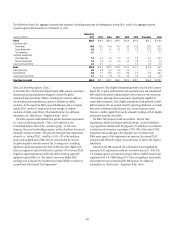
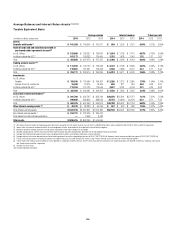
Long-Term Debt Issuances and Maturities
The table below details Citi’s long-term debt issuances and maturities (including repurchases and redemptions) during the periods presented:
2014 2013 2012
In billions of dollars Maturities Issuances Maturities Issuances Maturities Issuances
Parent $38.3 $36.0 $46.0 $30.7 $ 75.3 $17.3
Benchmark debt:
Senior debt 18.9 18.6 25.6 17.8 34.9 9.1
Subordinated debt 5.0 2.8 1.0 4.6 1.8 —
Trust preferred 2.1 — 6.4 — 5.9 —
Customer-related debt:
Structured debt 7.5 9.5 8.5 7.3 8.2 8.0
Non-structured debt 2.4 1.4 3.7 1.0 22.1 —
Local Country and Other 2.4 3.7 0.8 — 2.4 0.2
Bank $20.6 $30.8 $17.8 $23.7 $ 42.3 $10.4
TLGP — — — — 10.5 —
FHLB borrowings 8.0 13.9 11.8 9.5 2.7 8.0
Securitizations 8.9 13.6 2.4 11.5 25.2 0.5
Local Country and Other 3.7 3.3 3.6 2.7 3.9 1.9
Total $58.9 $66.8 $ 63.8 $54.4 $ 117.6 $27.7