Citibank 2014 Annual Report Download - page 120
Download and view the complete annual report
Please find page 120 of the 2014 Citibank annual report below. You can navigate through the pages in the report by either clicking on the pages listed below, or by using the keyword search tool below to find specific information within the annual report.-
 1
1 -
2
-
3
-
4
-
5
-
6
-
7
-
8
-
9
-
10
-
11
-
12
-
13
-
14
-
15
-
16
-
17
-
18
-
19
-
20
-
21
-
22
-
23
-
24
-
25
-
26
-
27
-
28
-
29
-
30
-
31
-
32
-
33
-
34
-
35
-
36
-
37
-
38
-
39
-
40
-
41
-
42
-
43
-
44
-
45
-
46
-
47
-
48
-
49
-
50
-
51
-
52
-
53
-
54
-
55
-
56
-
57
-
58
-
59
-
60
-
61
-
62
-
63
-
64
-
65
-
66
-
67
-
68
-
69
-
70
-
71
-
72
-
73
-
74
-
75
-
76
-
77
-
78
-
79
-
80
-
81
-
82
-
83
-
84
-
85
-
86
-
87
-
88
-
89
-
90
-
91
-
92
-
93
-
94
-
95
-
96
-
97
-
98
-
99
-
100
-
101
-
102
-
103
-
104
-
105
-
106
-
107
-
108
-
109
-
 110
110 -
 111
111 -
 112
112 -
 113
113 -
 114
114 -
 115
115 -
 116
116 -
 117
117 -
 118
118 -
 119
119 -
 120
120 -
 121
121 -
 122
122 -
 123
123 -
 124
124 -
 125
125 -
 126
126 -
 127
127 -
 128
128 -
 129
129 -
 130
130 -
131
-
132
-
133
-
134
-
135
-
136
-
137
-
138
-
139
-
140
-
141
-
142
-
143
-
144
-
145
-
146
-
147
-
148
-
149
-
150
-
151
-
152
-
153
-
154
-
155
-
156
-
157
-
158
-
159
-
160
-
161
-
162
-
163
-
164
-
165
-
166
-
167
-
168
-
169
-
170
-
171
-
172
-
173
-
174
-
175
-
176
-
177
-
178
-
179
-
180
-
181
-
182
-
183
-
184
-
185
-
186
-
187
-
188
-
189
-
190
-
191
-
192
-
193
-
194
-
195
-
196
-
197
-
198
-
199
-
200
-
201
-
202
-
203
-
204
-
205
-
206
-
207
-
208
-
209
-
210
-
211
-
212
-
213
-
214
-
215
-
216
-
217
-
218
-
219
-
220
-
221
-
222
-
223
-
224
-
225
-
226
-
227
-
228
-
229
-
230
-
231
-
232
-
233
-
234
-
235
-
236
-
237
-
238
-
239
-
240
-
241
-
242
-
243
-
244
-
245
-
246
-
247
-
248
-
249
-
250
-
251
-
252
-
253
-
254
-
255
-
256
-
257
-
258
-
259
-
260
-
261
-
262
-
263
-
264
-
265
-
266
-
267
-
268
-
269
-
270
-
271
-
272
-
273
-
274
-
275
-
276
-
277
-
278
-
279
-
280
-
281
-
282
-
283
-
284
-
285
-
286
-
287
-
288
-
289
-
290
-
291
-
292
-
293
-
294
-
295
-
296
-
297
-
298
-
299
-
300
-
301
-
302
-
303
-
304
-
305
-
306
-
307
-
308
-
309
-
310
-
311
-
312
-
313
-
314
-
315
-
316
-
317
-
318
-
319
-
320
-
321
-
322
-
323
-
324
-
325
-
326
-
327
 |
 |

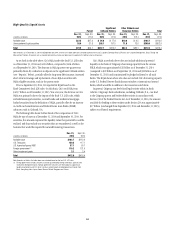
103
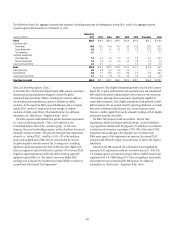
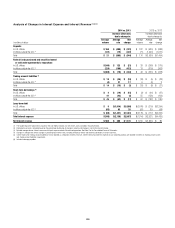
The following table sets forth the estimated impact to Citi’s net interest revenue, OCI and the Common Equity Tier 1 Capital ratio (on a fully implemented
basis), each assuming an unanticipated parallel instantaneous 100 basis point increase in interest rates.
In millions of dollars (unless otherwise noted)
Dec. 31,
2014
Sept. 30,
2014
Dec. 31,
2013
Estimated annualized impact to net interest revenue
U.S. dollar (1) $ 1,123 $ 1,159 $ 1,229
All other currencies 629 713 609
Total $ 1,752 $ 1,872 $ 1,838
As a % of average interest-earning assets 0.11% 0.11% 0.11%
Estimated initial impact to OCI (after-tax) (2) $(3,961) $(3,621) (3,070)
Estimated initial impact on Common Equity Tier 1 Capital ratio (bps) (3) (44) (41) (37)
(1) Certain trading-oriented businesses within Citi have accrual-accounted positions that are excluded from the estimated impact to net interest revenue in the table since these exposures are managed economically
in combination with mark-to-market positions. The U.S. dollar interest rate exposure associated with these businesses was $(148) million for a 100 basis point instantaneous increase in interest rates as of
December 31, 2014.
(2) Includes the effect of changes in interest rates on OCI related to investment securities, cash flow hedges and pension liability adjustments.
(3) The estimated initial impact to the Common Equity Tier 1 Capital ratio considers the effect of Citi’s deferred tax asset position and is based on only the estimated initial OCI impact above.
The decrease in the estimated impact to net interest revenue from the prior
year primarily reflected Citi Treasury actions (as described under “Mitigation
and Hedging of Interest Rate Risk” above), which more than offset changes
in balance sheet composition, including the continued seasoning of Citi’s
deposit balances and increases in Citi’s capital base. The change in the
estimated impact to OCI and the Common Equity Tier 1 Capital ratio
from the prior year primarily reflected changes in the composition of Citi
Treasury’s investment and interest rate derivatives portfolio.
In the event of an unanticipated parallel instantaneous 100 basis point
increase in interest rates, Citi expects the negative impact to OCI would
be offset in shareholders’ equity through the combination of expected
incremental net interest revenue and the expected recovery of the impact on
OCI through accretion of Citi’s investment portfolio over a period of time.
As of December 31, 2014, Citi expects that the negative $4.0 billion impact
to OCI in such a scenario could potentially be offset over approximately
22 months.
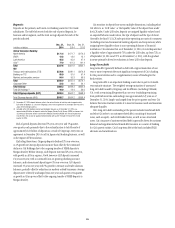
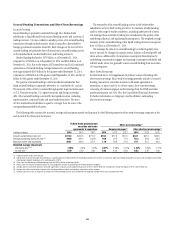
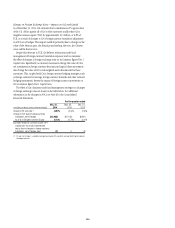
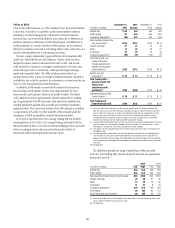
As noted above, Citi routinely evaluates multiple interest rate scenarios,
including interest rate increases and decreases and steepening and flattening
of the yield curve, to anticipate how net interest revenue and OCI might
be impacted in different interest rate environments. The following table
sets forth the estimated impact to Citi’s net interest revenue, OCI and the
Common Equity Tier 1 Capital ratio (on a fully implemented basis) under
four different changes in interest rates for the U.S. dollar and Citi’s other
currencies. While Citi also monitors the impact of a parallel decrease
in interest rates, a 100 basis point decrease in short-term interest rates
is not meaningful, as it would imply negative interest rates in many of
Citi’s markets.
In millions of dollars (unless otherwise noted) Scenario 1 Scenario 2 Scenario 3 Scenario 4
Overnight rate change (bps) 100 100 — —
10-year rate change (bps) 100 — 100 (100)
Estimated annualized impact to net interest revenue
U.S. dollar $ 1,123 $ 1,082 $ 95 $ (161)
All other currencies 629 586 36 (36)
Total $ 1,752 $ 1,668 $ 131 $ (197)
Estimated initial impact to OCI (after-tax) (1) $(3,961) $(2,543) $(1,597) $1,372
Estimated initial impact to Common Equity Tier 1 Capital ratio (bps) (2) (44) (28) (18) 15
Note: Each scenario in the table above assumes that the rate change will occur instantaneously. Changes in interest rates for maturities between the overnight rate and the 10-year are interpolated.
(1) Includes the effect of changes in interest rates on OCI related to investment securities, cash flow hedges and pension liability adjustments.
(2) The estimated initial impact to the Common Equity Tier 1 Capital ratio considers the effect of Citi’s deferred tax asset position and is based on only the estimated OCI impact above.
As shown in the table above, the magnitude of the impact to Citi’s
net interest revenue and OCI is greater under scenario 2 as compared to
scenario 3. This is because the combination of changes to Citi’s investment
portfolio, partially offset by changes related to Citi’s pension liabilities, results
in a net position that is more sensitive to rates at shorter and intermediate
term maturities.