Citibank 2014 Annual Report Download - page 286
Download and view the complete annual report
Please find page 286 of the 2014 Citibank annual report below. You can navigate through the pages in the report by either clicking on the pages listed below, or by using the keyword search tool below to find specific information within the annual report.-
 1
1 -
2
-
3
-
4
-
5
-
6
-
7
-
8
-
9
-
10
-
11
-
12
-
13
-
14
-
15
-
16
-
17
-
18
-
19
-
20
-
21
-
22
-
23
-
24
-
25
-
26
-
27
-
28
-
29
-
30
-
31
-
32
-
33
-
34
-
35
-
36
-
37
-
38
-
39
-
40
-
41
-
42
-
43
-
44
-
45
-
46
-
47
-
48
-
49
-
50
-
51
-
52
-
53
-
54
-
55
-
56
-
57
-
58
-
59
-
60
-
61
-
62
-
63
-
64
-
65
-
66
-
67
-
68
-
69
-
70
-
71
-
72
-
73
-
74
-
75
-
76
-
77
-
78
-
79
-
80
-
81
-
82
-
83
-
84
-
85
-
86
-
87
-
88
-
89
-
90
-
91
-
92
-
93
-
94
-
95
-
96
-
97
-
98
-
99
-
100
-
101
-
102
-
103
-
104
-
105
-
106
-
107
-
108
-
109
-
110
-
111
-
112
-
113
-
114
-
115
-
116
-
117
-
118
-
119
-
120
-
121
-
122
-
123
-
124
-
125
-
126
-
127
-
128
-
129
-
130
-
131
-
132
-
133
-
134
-
135
-
136
-
137
-
138
-
139
-
140
-
141
-
142
-
143
-
144
-
145
-
146
-
147
-
148
-
149
-
150
-
151
-
152
-
153
-
154
-
155
-
156
-
157
-
158
-
159
-
160
-
161
-
162
-
163
-
164
-
165
-
166
-
167
-
168
-
169
-
170
-
171
-
172
-
173
-
174
-
175
-
176
-
177
-
178
-
179
-
180
-
181
-
182
-
183
-
184
-
185
-
186
-
187
-
188
-
189
-
190
-
191
-
192
-
193
-
194
-
195
-
196
-
197
-
198
-
199
-
200
-
201
-
202
-
203
-
204
-
205
-
206
-
207
-
208
-
209
-
210
-
211
-
212
-
213
-
214
-
215
-
216
-
217
-
218
-
219
-
220
-
221
-
222
-
223
-
224
-
225
-
226
-
227
-
228
-
229
-
230
-
231
-
232
-
233
-
234
-
235
-
236
-
237
-
238
-
239
-
240
-
241
-
242
-
243
-
244
-
245
-
246
-
247
-
248
-
249
-
250
-
251
-
252
-
253
-
254
-
255
-
256
-
257
-
258
-
259
-
260
-
261
-
262
-
263
-
264
-
265
-
266
-
267
-
268
-
269
-
270
-
271
-
272
-
273
-
274
-
275
-
 276
276 -
 277
277 -
 278
278 -
 279
279 -
 280
280 -
 281
281 -
 282
282 -
 283
283 -
 284
284 -
 285
285 -
 286
286 -
 287
287 -
 288
288 -
 289
289 -
 290
290 -
 291
291 -
 292
292 -
 293
293 -
 294
294 -
 295
295 -
 296
296 -
297
-
298
-
299
-
300
-
301
-
302
-
303
-
304
-
305
-
306
-
307
-
308
-
309
-
310
-
311
-
312
-
313
-
314
-
315
-
316
-
317
-
318
-
319
-
320
-
321
-
322
-
323
-
324
-
325
-
326
-
327
 |
 |

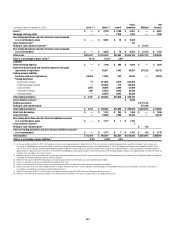
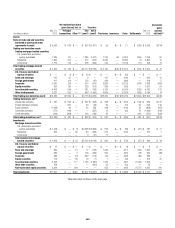
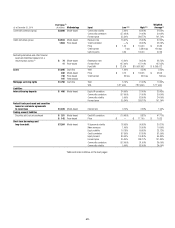
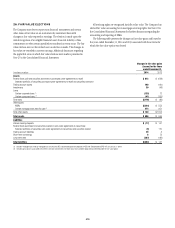
269
In millions of dollars
Dec. 31,
2012
Net realized/unrealized
gains (losses) incl. in Transfers
Purchases Issuances Sales Settlements
Dec. 31,
2013
Unrealized
gains
(losses)
still held (3)
Principal
transactions Other (1)(2)
into
Level 3
out of
Level 3
Loans $ 4,931 $ — $ (24) $ 353 $ — $ 179 $ 652 $ (192) $(1,756) $ 4,143 $ (122)
Mortgage servicing rights 1,942 — 555 — — — 634 (2) (411) 2,718 553
Other financial assets measured on
a recurring basis 2,452 — 63 1 — 216 474 (2,046) (979) 181 (5)
Liabilities
Interest-bearing deposits $ 786 $ — $(125) $ 32 $ (21) $ — $ 86 $ — $ (118) $ 890 $ (41)
Federal funds purchased and
securities loaned or sold under
agreements to repurchase 841 91 — 216 (17) 36 — 40 (123) 902 50
Trading account liabilities
Securities sold, not yet purchased 365 42 — 89 (52) — — 612 (382) 590 73
Short-term borrowings 112 53 — 2 (10) — 316 — (338) 29 (5)
Long-term debt 6,726 292 153 3,738 (2,531) — 1,466 (1) (1,332) 7,621 758
Other financial liabilities measured
on a recurring basis 24 — (215) 5 (2) (5) 104 — (331) 10 (9)
(1) Changes in fair value for available-for-sale investments are recorded in Accumulated other comprehensive income (loss), unless other-than-temporarily impaired, while gains and losses from sales are recorded in
Realized gains (losses) from sales of investments on the Consolidated Statement of Income.
(2) Unrealized gains (losses) on MSRs are recorded in Other revenue on the Consolidated Statement of Income.
(3) Represents the amount of total gains or losses for the period, included in earnings (and Accumulated other comprehensive income (loss) for changes in fair value of available-for-sale investments), attributable to the
change in fair value relating to assets and liabilities classified as Level 3 that are still held at December 31, 2013.
(4) Total Level 3 derivative assets and liabilities have been netted in these tables for presentation purposes only.
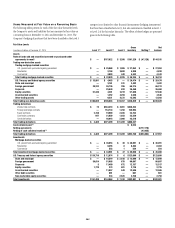
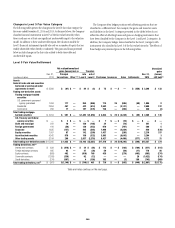
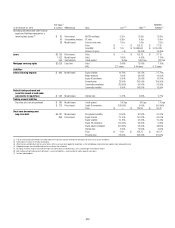
Level 3 Fair Value Rollforward
The following were the significant Level 3 transfers for the period
December 31, 2013 to December 31, 2014:
•Transfers of Long-term debt of $2.7 billion from Level 2 to Level 3, and
of $4.2 billion from Level 3 to Level 2, mainly related to structured debt,
reflecting changes in the significance of unobservable inputs as well as
certain underlying market inputs becoming less or more observable.
•Transfers of Other trading assets of $2.6 billion from Level 2 to Level 3,
and of $2.3 billion from Level 3 to Level 2, related to trading loans,
reflecting changes in the volume of market quotations.
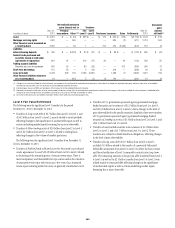
The following were the significant Level 3 transfers from December 31,
2012 to December 31, 2013:
•Transfers of Federal funds sold and securities borrowed or purchased
under agreements to resell of $1.9 billion from Level 3 to Level 2 related
to shortening of the remaining tenor of certain reverse repos. There is
more transparency and observability for repo curves used in the valuation
of structured reverse repos with tenors up to five years; thus, structured
reverse repos maturing within five years are generally classified as Level 2.
•Transfers of U.S. government-sponsored agency guaranteed mortgage-
backed securities in Investments of $2.1 billion from Level 2 to Level 3,
and of $3.8 billion from Level 3 to Level 2, due to changes in the level of
price observability for the specific securities. Similarly, there were transfers
of U.S. government-sponsored agency guaranteed mortgage-backed
securities in Trading securities of $1.4 billion from Level 2 to Level 3, and
of $1.5 billion from Level 3 to Level 2.
•Transfers of asset-backed securities in Investments of $1.2 billion from
Level 2 to Level 3, and of $1.7 billion from Level 3 to Level 2. These
transfers were related to collateralized loan obligations, reflecting changes
in the level of price observability.
•Transfers of Long-term debt of $3.7 billion from Level 2 to Level 3,
included $1.3 billion related to the transfer of a previously bifurcated
hybrid debt instrument from Level 2 to Level 3 to reflect the host contract
and the reclassification of Level 3 commodity contracts into Long-term
debt. The remaining amounts of Long-term debt transferred from Level 2
to Level 3 as well as the $2.5 billion transfer from Level 3 to Level 2 were
related mainly to structured debt reflecting changes in the significance
of unobservable inputs as well as certain underlying market inputs
becoming less or more observable.