Citibank 2014 Annual Report Download - page 111
Download and view the complete annual report
Please find page 111 of the 2014 Citibank annual report below. You can navigate through the pages in the report by either clicking on the pages listed below, or by using the keyword search tool below to find specific information within the annual report.-
 1
1 -
2
-
3
-
4
-
5
-
6
-
7
-
8
-
9
-
10
-
11
-
12
-
13
-
14
-
15
-
16
-
17
-
18
-
19
-
20
-
21
-
22
-
23
-
24
-
25
-
26
-
27
-
28
-
29
-
30
-
31
-
32
-
33
-
34
-
35
-
36
-
37
-
38
-
39
-
40
-
41
-
42
-
43
-
44
-
45
-
46
-
47
-
48
-
49
-
50
-
51
-
52
-
53
-
54
-
55
-
56
-
57
-
58
-
59
-
60
-
61
-
62
-
63
-
64
-
65
-
66
-
67
-
68
-
69
-
70
-
71
-
72
-
73
-
74
-
75
-
76
-
77
-
78
-
79
-
80
-
81
-
82
-
83
-
84
-
85
-
86
-
87
-
88
-
89
-
90
-
91
-
92
-
93
-
94
-
95
-
96
-
97
-
98
-
99
-
100
-
 101
101 -
 102
102 -
 103
103 -
 104
104 -
 105
105 -
 106
106 -
 107
107 -
 108
108 -
 109
109 -
 110
110 -
 111
111 -
 112
112 -
 113
113 -
 114
114 -
 115
115 -
 116
116 -
 117
117 -
 118
118 -
 119
119 -
 120
120 -
 121
121 -
122
-
123
-
124
-
125
-
126
-
127
-
128
-
129
-
130
-
131
-
132
-
133
-
134
-
135
-
136
-
137
-
138
-
139
-
140
-
141
-
142
-
143
-
144
-
145
-
146
-
147
-
148
-
149
-
150
-
151
-
152
-
153
-
154
-
155
-
156
-
157
-
158
-
159
-
160
-
161
-
162
-
163
-
164
-
165
-
166
-
167
-
168
-
169
-
170
-
171
-
172
-
173
-
174
-
175
-
176
-
177
-
178
-
179
-
180
-
181
-
182
-
183
-
184
-
185
-
186
-
187
-
188
-
189
-
190
-
191
-
192
-
193
-
194
-
195
-
196
-
197
-
198
-
199
-
200
-
201
-
202
-
203
-
204
-
205
-
206
-
207
-
208
-
209
-
210
-
211
-
212
-
213
-
214
-
215
-
216
-
217
-
218
-
219
-
220
-
221
-
222
-
223
-
224
-
225
-
226
-
227
-
228
-
229
-
230
-
231
-
232
-
233
-
234
-
235
-
236
-
237
-
238
-
239
-
240
-
241
-
242
-
243
-
244
-
245
-
246
-
247
-
248
-
249
-
250
-
251
-
252
-
253
-
254
-
255
-
256
-
257
-
258
-
259
-
260
-
261
-
262
-
263
-
264
-
265
-
266
-
267
-
268
-
269
-
270
-
271
-
272
-
273
-
274
-
275
-
276
-
277
-
278
-
279
-
280
-
281
-
282
-
283
-
284
-
285
-
286
-
287
-
288
-
289
-
290
-
291
-
292
-
293
-
294
-
295
-
296
-
297
-
298
-
299
-
300
-
301
-
302
-
303
-
304
-
305
-
306
-
307
-
308
-
309
-
310
-
311
-
312
-
313
-
314
-
315
-
316
-
317
-
318
-
319
-
320
-
321
-
322
-
323
-
324
-
325
-
326
-
327
 |
 |
94
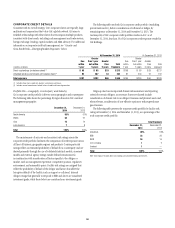
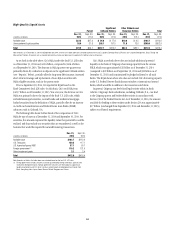
High-Quality Liquid Assets
Parent
Significant
Citibank Entities
Other Citibank and
Banamex Entities Total
In billions of dollars
Dec. 31,
2014
Sept. 30,
2014
Dec. 31,
2014
Sept. 30,
2014
Dec. 31,
2014
Sept. 30,
2014
Dec. 31,
2014
Sept. 30,
2014
Available cash $37.5 $27.3 $ 54.6 $ 77.8 $10.6 $ 8.5 $102.7 $113.6
Unencumbered liquid securities 35.0 31.8 203.1 197.5 71.8 73.6 $309.9 $302.9
Total $72.5 $59.1 $257.7 $275.3 $82.4 $82.1 $412.6 $416.4
Note: Amounts as of December 31, 2014 and September 30, 2014 set forth in the table above are estimated based on the final U.S. Liquidity Coverage Ratio (LCR) rules (see “Liquidity Management, Stress Testing and
Measurement” below). All amounts are as of period end and may increase or decrease intra-period in the ordinary course of business.
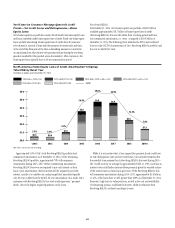
As set forth in the table above, Citi’s HQLA under the final U.S. LCR rules
as of December 31, 2014 was $412.6 billion, compared to $416.4 billion
as of September 30, 2014. The decrease in HQLA quarter-over-quarter was
primarily driven by a reduction in deposits in the significant Citibank entities
(see “Deposits” below), partially offset by long-term debt issuance, increased
short-term borrowings and replacement of non-HQLA securities with
HQLA-eligible securities, each in the parent entity.
Prior to September 30, 2014, Citi reported its HQLA based on the
Basel Committee’s final LCR rules. On this basis, Citi’s total HQLA was
$423.7 billion as of December 31, 2013. Year-over-year, the decrease in Citi’s
HQLA was primarily due to the impact of the final U.S. LCR rules, which
excluded municipal securities, covered bonds and residential mortgage-
backed securities from the definition of HQLA, partially offset by an increase
in credit card securitizations and Federal Home Loan Banks (FHLB)
advances, each in Citibank, N.A.
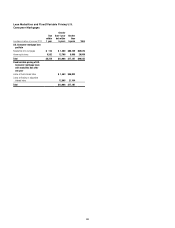
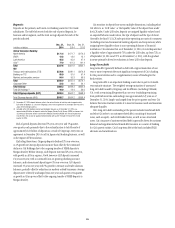
The following table shows further detail of the composition of Citi’s
HQLA by type of asset as of December 31, 2014 and September 30, 2014. For
securities, the amounts represent the liquidity value that potentially could be
realized, and thus exclude any securities that are encumbered, as well as the
haircuts that would be required for secured financing transactions.
In billions of dollars
Dec. 31,
2014
Sept. 30,
2014
Available cash $102.7 $113.6
U.S. Treasuries 139.5 117.1
U.S. Agencies/Agency MBS 57.1 60.7
Foreign government (1) 110.2 121.6
Other investment grade 3.1 3.4
Total $412.6 $416.4
Note: Amounts set forth in the table above are estimated based on the final U.S. LCR rules.
(1) Foreign government includes securities issued or guaranteed by foreign sovereigns, agencies and
multilateral development banks. Foreign government securities are held largely to support local
liquidity requirements and Citi’s local franchises and principally included government bonds from
Brazil, Hong Kong, India, Japan, Korea, Mexico, Poland, Singapore and Taiwan.
Citi’s HQLA as set forth above does not include additional potential
liquidity in the form of Citigroup’s borrowing capacity from the various
FHLB, which was approximately $26 billion as of December 31, 2014
(compared to $22 billion as of September 30, 2014 and $30 billion as of
December 31, 2013) and is maintained by pledged collateral to all such
banks. The HQLA shown above also does not include Citi’s borrowing capacity
at the U.S. Federal Reserve Bank discount window or international central
banks, which would be in addition to the resources noted above.
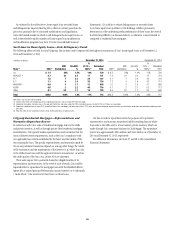
In general, Citigroup can freely fund legal entities within its bank
vehicles. Citigroup’s bank subsidiaries, including Citibank, N.A., can lend
to the Citigroup parent and broker-dealer entities in accordance with
Section 23A of the Federal Reserve Act. As of December 31, 2014, the amount
available for lending to these entities under Section 23A was approximately
$17 billion (unchanged from September 30, 2014 and December 31, 2013),
subject to collateral requirements.