Citibank 2014 Annual Report Download - page 26
Download and view the complete annual report
Please find page 26 of the 2014 Citibank annual report below. You can navigate through the pages in the report by either clicking on the pages listed below, or by using the keyword search tool below to find specific information within the annual report.-
 1
1 -
2
-
3
-
4
-
5
-
6
-
7
-
8
-
9
-
10
-
11
-
12
-
13
-
14
-
15
-
 16
16 -
 17
17 -
 18
18 -
 19
19 -
 20
20 -
 21
21 -
 22
22 -
 23
23 -
 24
24 -
 25
25 -
 26
26 -
 27
27 -
 28
28 -
 29
29 -
 30
30 -
 31
31 -
 32
32 -
 33
33 -
 34
34 -
 35
35 -
 36
36 -
37
-
38
-
39
-
40
-
41
-
42
-
43
-
44
-
45
-
46
-
47
-
48
-
49
-
50
-
51
-
52
-
53
-
54
-
55
-
56
-
57
-
58
-
59
-
60
-
61
-
62
-
63
-
64
-
65
-
66
-
67
-
68
-
69
-
70
-
71
-
72
-
73
-
74
-
75
-
76
-
77
-
78
-
79
-
80
-
81
-
82
-
83
-
84
-
85
-
86
-
87
-
88
-
89
-
90
-
91
-
92
-
93
-
94
-
95
-
96
-
97
-
98
-
99
-
100
-
101
-
102
-
103
-
104
-
105
-
106
-
107
-
108
-
109
-
110
-
111
-
112
-
113
-
114
-
115
-
116
-
117
-
118
-
119
-
120
-
121
-
122
-
123
-
124
-
125
-
126
-
127
-
128
-
129
-
130
-
131
-
132
-
133
-
134
-
135
-
136
-
137
-
138
-
139
-
140
-
141
-
142
-
143
-
144
-
145
-
146
-
147
-
148
-
149
-
150
-
151
-
152
-
153
-
154
-
155
-
156
-
157
-
158
-
159
-
160
-
161
-
162
-
163
-
164
-
165
-
166
-
167
-
168
-
169
-
170
-
171
-
172
-
173
-
174
-
175
-
176
-
177
-
178
-
179
-
180
-
181
-
182
-
183
-
184
-
185
-
186
-
187
-
188
-
189
-
190
-
191
-
192
-
193
-
194
-
195
-
196
-
197
-
198
-
199
-
200
-
201
-
202
-
203
-
204
-
205
-
206
-
207
-
208
-
209
-
210
-
211
-
212
-
213
-
214
-
215
-
216
-
217
-
218
-
219
-
220
-
221
-
222
-
223
-
224
-
225
-
226
-
227
-
228
-
229
-
230
-
231
-
232
-
233
-
234
-
235
-
236
-
237
-
238
-
239
-
240
-
241
-
242
-
243
-
244
-
245
-
246
-
247
-
248
-
249
-
250
-
251
-
252
-
253
-
254
-
255
-
256
-
257
-
258
-
259
-
260
-
261
-
262
-
263
-
264
-
265
-
266
-
267
-
268
-
269
-
270
-
271
-
272
-
273
-
274
-
275
-
276
-
277
-
278
-
279
-
280
-
281
-
282
-
283
-
284
-
285
-
286
-
287
-
288
-
289
-
290
-
291
-
292
-
293
-
294
-
295
-
296
-
297
-
298
-
299
-
300
-
301
-
302
-
303
-
304
-
305
-
306
-
307
-
308
-
309
-
310
-
311
-
312
-
313
-
314
-
315
-
316
-
317
-
318
-
319
-
320
-
321
-
322
-
323
-
324
-
325
-
326
-
327
 |
 |

9
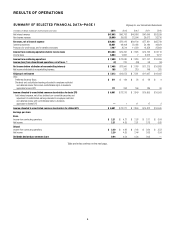
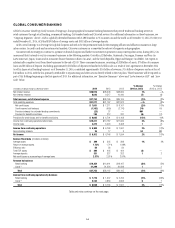
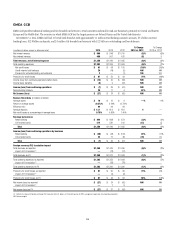
RESULTS OF OPERATIONS
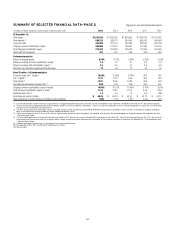
SUMMARY OF SELECTED FINANCIAL DATA—PAGE 1
In millions of dollars, except per-share amounts and ratios 2014 2013 2012 2011 2010
Net interest revenue $47,993 $46,793 $46,686 $47,649 $53,539
Non-interest revenue 28,889 29,626 22,504 29,612 32,210
Revenues, net of interest expense $76,882 $76,419 $69,190 $77,261 $85,749
Operating expenses 55,051 48,408 50,036 50,180 46,824
Provisions for credit losses and for benefits and claims 7,467 8,514 11,329 12,359 25,809
Income from continuing operations before income taxes $14,364 $19,497 $ 7,825 $14,722 $13,116
Income taxes 6,864 5,867 7 3,575 2,217
Income from continuing operations $ 7,500 $13,630 $ 7,818 $11,147 $10,899
Income (loss) from discontinued operations, net of taxes (1) (2) 270 (58) 68 (16)
Net income before attribution of noncontrolling interests $ 7,498 $13,900 $ 7,760 $11,215 $10,883
Net income attributable to noncontrolling interests 185 227 219 148 281
Citigroup’s net income $ 7,313 $13,673 $ 7,541 $11,067 $10,602
Less:
Preferred dividends-Basic $ 511 $ 194 $ 26 $ 26 $ 9
Dividends and undistributed earnings allocated to employee restricted
and deferred shares that contain nonforfeitable rights to dividends,
applicable to basic EPS 111 263 166 186 90
Income allocated to unrestricted common shareholders for basic EPS $ 6,691 $13,216 $ 7,349 $10,855 $10,503
Add: Interest expense, net of tax, dividends on convertible securities and
adjustment of undistributed earnings allocated to employee restricted
and deferred shares with nonforfeitable rights to dividends,
applicable to diluted EPS —1 11 17 2
Income allocated to unrestricted common shareholders for diluted EPS $ 6,691 $13,217 $ 7,360 $10,872 $10,505
Earnings per share
Basic
Income from continuing operations $ 2.21 $ 4.27 $ 2.53 $ 3.71 $ 3.64
Net income 2.21 4.35 2.51 3.73 3.65
Diluted
Income from continuing operations $ 2.20 $ 4.26 $ 2.46 $ 3.60 $ 3.53
Net income 2.20 4.35 2.44 3.63 3.54
Dividends declared per common share 0.04 0.04 0.04 0.03 —
Table and notes continue on the next page.
Citigroup Inc. and Consolidated Subsidiaries