Citibank 2014 Annual Report Download - page 43
Download and view the complete annual report
Please find page 43 of the 2014 Citibank annual report below. You can navigate through the pages in the report by either clicking on the pages listed below, or by using the keyword search tool below to find specific information within the annual report.-
 1
1 -
2
-
3
-
4
-
5
-
6
-
7
-
8
-
9
-
10
-
11
-
12
-
13
-
14
-
15
-
16
-
17
-
18
-
19
-
20
-
21
-
22
-
23
-
24
-
25
-
26
-
27
-
28
-
29
-
30
-
31
-
32
-
 33
33 -
 34
34 -
 35
35 -
 36
36 -
 37
37 -
 38
38 -
 39
39 -
 40
40 -
 41
41 -
 42
42 -
 43
43 -
 44
44 -
 45
45 -
 46
46 -
 47
47 -
 48
48 -
 49
49 -
 50
50 -
 51
51 -
 52
52 -
 53
53 -
54
-
55
-
56
-
57
-
58
-
59
-
60
-
61
-
62
-
63
-
64
-
65
-
66
-
67
-
68
-
69
-
70
-
71
-
72
-
73
-
74
-
75
-
76
-
77
-
78
-
79
-
80
-
81
-
82
-
83
-
84
-
85
-
86
-
87
-
88
-
89
-
90
-
91
-
92
-
93
-
94
-
95
-
96
-
97
-
98
-
99
-
100
-
101
-
102
-
103
-
104
-
105
-
106
-
107
-
108
-
109
-
110
-
111
-
112
-
113
-
114
-
115
-
116
-
117
-
118
-
119
-
120
-
121
-
122
-
123
-
124
-
125
-
126
-
127
-
128
-
129
-
130
-
131
-
132
-
133
-
134
-
135
-
136
-
137
-
138
-
139
-
140
-
141
-
142
-
143
-
144
-
145
-
146
-
147
-
148
-
149
-
150
-
151
-
152
-
153
-
154
-
155
-
156
-
157
-
158
-
159
-
160
-
161
-
162
-
163
-
164
-
165
-
166
-
167
-
168
-
169
-
170
-
171
-
172
-
173
-
174
-
175
-
176
-
177
-
178
-
179
-
180
-
181
-
182
-
183
-
184
-
185
-
186
-
187
-
188
-
189
-
190
-
191
-
192
-
193
-
194
-
195
-
196
-
197
-
198
-
199
-
200
-
201
-
202
-
203
-
204
-
205
-
206
-
207
-
208
-
209
-
210
-
211
-
212
-
213
-
214
-
215
-
216
-
217
-
218
-
219
-
220
-
221
-
222
-
223
-
224
-
225
-
226
-
227
-
228
-
229
-
230
-
231
-
232
-
233
-
234
-
235
-
236
-
237
-
238
-
239
-
240
-
241
-
242
-
243
-
244
-
245
-
246
-
247
-
248
-
249
-
250
-
251
-
252
-
253
-
254
-
255
-
256
-
257
-
258
-
259
-
260
-
261
-
262
-
263
-
264
-
265
-
266
-
267
-
268
-
269
-
270
-
271
-
272
-
273
-
274
-
275
-
276
-
277
-
278
-
279
-
280
-
281
-
282
-
283
-
284
-
285
-
286
-
287
-
288
-
289
-
290
-
291
-
292
-
293
-
294
-
295
-
296
-
297
-
298
-
299
-
300
-
301
-
302
-
303
-
304
-
305
-
306
-
307
-
308
-
309
-
310
-
311
-
312
-
313
-
314
-
315
-
316
-
317
-
318
-
319
-
320
-
321
-
322
-
323
-
324
-
325
-
326
-
327
 |
 |
26
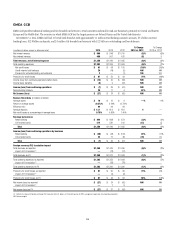
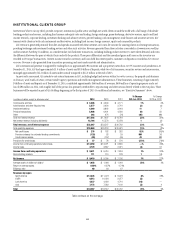
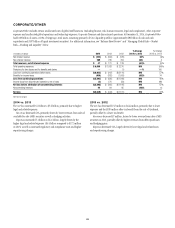
The discussion of the results of operations for ICG below excludes the impact of CVA/DVA for all periods presented. Presentations of the results of
operations, excluding the impact of CVA/DVA and the impact of gains/(losses) on hedges on accrual loans, are non-GAAP financial measures. Citi
believes the presentation of ICG’s results excluding the impact of these items is a more meaningful depiction of the underlying fundamentals of the
business. For a reconciliation of these metrics to the reported results, see the table above.
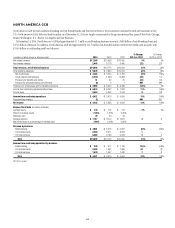
2014 vs. 2013
Net income increased 1%, primarily driven by lower expenses and lower
credit costs, largely offset by lower revenues. Excluding the impact of the net
fraud loss in 2013 (see “Executive Summary” above), net income decreased
1%, primarily driven by the lower revenues and higher expenses, largely offset
by the lower credit costs.
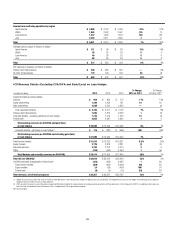
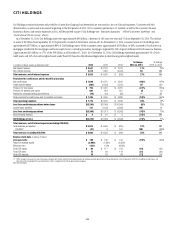
• Revenues decreased 1%, reflecting lower revenues in Markets and
securities services (decrease of 8%), partially offset by higher revenues in
Banking (increase of 7%, 5% excluding the gains/(losses) on hedges on
accrual loans). Citi expects revenues in ICG, particularly in its Markets
and securities services businesses, will likely continue to reflect the
overall market environment.
Within Banking:
• Investment banking revenues increased 7%, reflecting a stronger overall
market environment and improved wallet share with ICG’s target clients,
partially offset by a modest decline in overall wallet share. The decline in
overall wallet share was primarily driven by equity and debt underwriting
and reflected market fragmentation. Advisory revenues increased 11%,
reflecting the increased target client activity and an expansion of the
overall M&A market. Equity underwriting revenues increased 18% largely
in line with overall growth in market fees. Debt underwriting revenues
were largely unchanged.
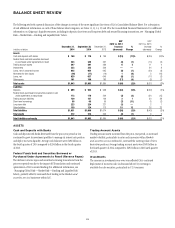
• Treasury and trade solutions revenues increased 1%, as continued
higher deposit balances, fee growth and trade activity were partially offset
by the impact of spread compression globally. End-of-period deposit
balances were unchanged, but increased 3% excluding the impact of
FX translation, largely driven by North America. Average trade loans
decreased 9% (7% excluding the impact of FX translation), as the
business maintained origination volumes while reducing lower spread
assets and increasing asset sales to optimize returns (see “Balance Sheet
Review” below).
• Corporate lending revenues increased 52%. Excluding the impact of
gains/(losses) on hedges on accrual loans, revenues increased 15%,
primarily due to continued growth in average loan balances and lower
funding costs. (For information on Citi’s corporate credit exposure to
the energy sector, see “Managing Global Risk—Credit Risk—Corporate
Credit Details” below.)
• Private bank revenues increased 7% due to growth in client business
volumes and improved spreads in banking, higher capital markets activity
and an increase in assets under management in managed investments,
partially offset by continued spread compression in lending.
Within Markets and securities services:
• Fixed income markets revenues decreased 11%, driven by a decrease
in rates and currencies revenues, partially offset by increased securitized
products and commodities revenues. Rates and currencies revenues
declined due to historically muted levels of volatility, uncertainties around
Russia and Greece and lower client activity in the first half of 2014. In
addition, the first half of 2013 included a strong performance in rates and
currencies, driven in part by the impact of quantitative easing globally.
Municipals and credit markets revenues declined due to challenging
trading conditions resulting from macroeconomic uncertainties,
particularly in the fourth quarter of 2014. These declines were partially
offset by increased securitized products and commodities revenues, largely
in North America.
• Equity markets revenues decreased 1%, primarily reflecting weakness in
EMEA, particularly cash equities, driven by volatility in Europe, largely
offset by improved performance in prime finance due to increased
customer flows.
• Securities services revenues increased 3% due to increased volumes, assets
under custody and overall client activity.
Expenses decreased 1%, as efficiency savings, the absence of the net
fraud loss in 2014 and lower performance-based compensation was partially
offset by higher repositioning charges and legal and related expenses as
well as increased regulatory and compliance costs. Excluding the impact
of the net fraud loss, expenses increased 1%, as higher repositioning
charges and legal and related expenses as well as increased regulatory
and compliance costs were partially offset by efficiency savings and lower
performance-based compensation.
Provisions decreased 27%, primarily reflecting an improvement in the
provision for unfunded lending commitments in the corporate loan portfolio,
partially offset by higher net credit losses and a lower loan loss reserve release
driven by the overall economic environment. Net credit losses increased 52%,
largely related to the Petróleos Mexicanos (Pemex) supplier program in the
first quarter of 2014 (for additional information, see Citi’s Form 8-K filed
with the SEC on February 28, 2014) as well as write-offs related to a specific
counterparty. For information on certain legal and regulatory matters
related to the Pemex supplier program, see Note 28 to the Consolidated
Financial Statements.