Citibank 2014 Annual Report Download - page 192
Download and view the complete annual report
Please find page 192 of the 2014 Citibank annual report below. You can navigate through the pages in the report by either clicking on the pages listed below, or by using the keyword search tool below to find specific information within the annual report.-
 1
1 -
2
-
3
-
4
-
5
-
6
-
7
-
8
-
9
-
10
-
11
-
12
-
13
-
14
-
15
-
16
-
17
-
18
-
19
-
20
-
21
-
22
-
23
-
24
-
25
-
26
-
27
-
28
-
29
-
30
-
31
-
32
-
33
-
34
-
35
-
36
-
37
-
38
-
39
-
40
-
41
-
42
-
43
-
44
-
45
-
46
-
47
-
48
-
49
-
50
-
51
-
52
-
53
-
54
-
55
-
56
-
57
-
58
-
59
-
60
-
61
-
62
-
63
-
64
-
65
-
66
-
67
-
68
-
69
-
70
-
71
-
72
-
73
-
74
-
75
-
76
-
77
-
78
-
79
-
80
-
81
-
82
-
83
-
84
-
85
-
86
-
87
-
88
-
89
-
90
-
91
-
92
-
93
-
94
-
95
-
96
-
97
-
98
-
99
-
100
-
101
-
102
-
103
-
104
-
105
-
106
-
107
-
108
-
109
-
110
-
111
-
112
-
113
-
114
-
115
-
116
-
117
-
118
-
119
-
120
-
121
-
122
-
123
-
124
-
125
-
126
-
127
-
128
-
129
-
130
-
131
-
132
-
133
-
134
-
135
-
136
-
137
-
138
-
139
-
140
-
141
-
142
-
143
-
144
-
145
-
146
-
147
-
148
-
149
-
150
-
151
-
152
-
153
-
154
-
155
-
156
-
157
-
158
-
159
-
160
-
161
-
162
-
163
-
164
-
165
-
166
-
167
-
168
-
169
-
170
-
171
-
172
-
173
-
174
-
175
-
176
-
177
-
178
-
179
-
180
-
181
-
 182
182 -
 183
183 -
 184
184 -
 185
185 -
 186
186 -
 187
187 -
 188
188 -
 189
189 -
 190
190 -
 191
191 -
 192
192 -
 193
193 -
 194
194 -
 195
195 -
 196
196 -
 197
197 -
 198
198 -
 199
199 -
 200
200 -
 201
201 -
 202
202 -
203
-
204
-
205
-
206
-
207
-
208
-
209
-
210
-
211
-
212
-
213
-
214
-
215
-
216
-
217
-
218
-
219
-
220
-
221
-
222
-
223
-
224
-
225
-
226
-
227
-
228
-
229
-
230
-
231
-
232
-
233
-
234
-
235
-
236
-
237
-
238
-
239
-
240
-
241
-
242
-
243
-
244
-
245
-
246
-
247
-
248
-
249
-
250
-
251
-
252
-
253
-
254
-
255
-
256
-
257
-
258
-
259
-
260
-
261
-
262
-
263
-
264
-
265
-
266
-
267
-
268
-
269
-
270
-
271
-
272
-
273
-
274
-
275
-
276
-
277
-
278
-
279
-
280
-
281
-
282
-
283
-
284
-
285
-
286
-
287
-
288
-
289
-
290
-
291
-
292
-
293
-
294
-
295
-
296
-
297
-
298
-
299
-
300
-
301
-
302
-
303
-
304
-
305
-
306
-
307
-
308
-
309
-
310
-
311
-
312
-
313
-
314
-
315
-
316
-
317
-
318
-
319
-
320
-
321
-
322
-
323
-
324
-
325
-
326
-
327
 |
 |

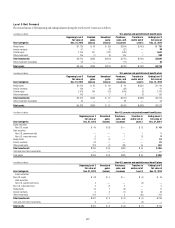
175
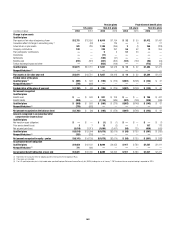
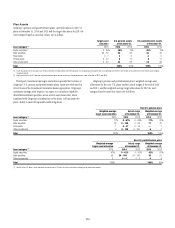
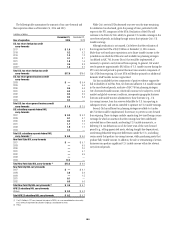
In millions of dollars U.S. pension and postretirement benefit plans (1)
Fair value measurement at December 31, 2013
Asset categories Level 1 Level 2 Level 3 Total
Equity securities
U.S. equity $ 793 $ — $ — $ 793
Non-U.S. equity 442 — — 442
Mutual funds 203 — — 203
Commingled funds — 977 — 977
Debt securities
U.S. Treasuries 1,112 — — 1,112
U.S. agency — 91 — 91
U.S. corporate bonds — 1,387 — 1,387
Non-U.S. government debt — 349 — 349
Non-U.S. corporate bonds — 398 — 398
State and municipal debt — 137 — 137
Hedge funds — 2,132 1,126 3,258
Asset-backed securities — 61 — 61
Mortgage-backed securities — 64 — 64
Annuity contracts — — 91 91
Private equity — — 2,106 2,106
Derivatives 8 601 — 609
Other investments — 29 150 179
Total investments at fair value $ 2,558 $ 6,226 $ 3,473 $12,257
Cash and short-term investments $ 107 $ 957 $ — $ 1,064
Other investment receivables — 49 52 101
Total assets $ 2,665 $ 7,232 $ 3,525 $13,422
Other investment liabilities $ (9) $ (650) $ — $ (659)
Total net assets $ 2,656 $ 6,582 $ 3,525 $12,763
(1) The investments of the U.S. pension and postretirement benefit plans are commingled in one trust. At December 31, 2013, the allocable interests of the U.S. pension and postretirement benefit plans were 99.7% and
0.3%, respectively.