Citibank 2014 Annual Report Download - page 151
Download and view the complete annual report
Please find page 151 of the 2014 Citibank annual report below. You can navigate through the pages in the report by either clicking on the pages listed below, or by using the keyword search tool below to find specific information within the annual report.-
 1
1 -
2
-
3
-
4
-
5
-
6
-
7
-
8
-
9
-
10
-
11
-
12
-
13
-
14
-
15
-
16
-
17
-
18
-
19
-
20
-
21
-
22
-
23
-
24
-
25
-
26
-
27
-
28
-
29
-
30
-
31
-
32
-
33
-
34
-
35
-
36
-
37
-
38
-
39
-
40
-
41
-
42
-
43
-
44
-
45
-
46
-
47
-
48
-
49
-
50
-
51
-
52
-
53
-
54
-
55
-
56
-
57
-
58
-
59
-
60
-
61
-
62
-
63
-
64
-
65
-
66
-
67
-
68
-
69
-
70
-
71
-
72
-
73
-
74
-
75
-
76
-
77
-
78
-
79
-
80
-
81
-
82
-
83
-
84
-
85
-
86
-
87
-
88
-
89
-
90
-
91
-
92
-
93
-
94
-
95
-
96
-
97
-
98
-
99
-
100
-
101
-
102
-
103
-
104
-
105
-
106
-
107
-
108
-
109
-
110
-
111
-
112
-
113
-
114
-
115
-
116
-
117
-
118
-
119
-
120
-
121
-
122
-
123
-
124
-
125
-
126
-
127
-
128
-
129
-
130
-
131
-
132
-
133
-
134
-
135
-
136
-
137
-
138
-
139
-
140
-
 141
141 -
 142
142 -
 143
143 -
 144
144 -
 145
145 -
 146
146 -
 147
147 -
 148
148 -
 149
149 -
 150
150 -
 151
151 -
 152
152 -
 153
153 -
 154
154 -
 155
155 -
 156
156 -
 157
157 -
 158
158 -
 159
159 -
 160
160 -
 161
161 -
162
-
163
-
164
-
165
-
166
-
167
-
168
-
169
-
170
-
171
-
172
-
173
-
174
-
175
-
176
-
177
-
178
-
179
-
180
-
181
-
182
-
183
-
184
-
185
-
186
-
187
-
188
-
189
-
190
-
191
-
192
-
193
-
194
-
195
-
196
-
197
-
198
-
199
-
200
-
201
-
202
-
203
-
204
-
205
-
206
-
207
-
208
-
209
-
210
-
211
-
212
-
213
-
214
-
215
-
216
-
217
-
218
-
219
-
220
-
221
-
222
-
223
-
224
-
225
-
226
-
227
-
228
-
229
-
230
-
231
-
232
-
233
-
234
-
235
-
236
-
237
-
238
-
239
-
240
-
241
-
242
-
243
-
244
-
245
-
246
-
247
-
248
-
249
-
250
-
251
-
252
-
253
-
254
-
255
-
256
-
257
-
258
-
259
-
260
-
261
-
262
-
263
-
264
-
265
-
266
-
267
-
268
-
269
-
270
-
271
-
272
-
273
-
274
-
275
-
276
-
277
-
278
-
279
-
280
-
281
-
282
-
283
-
284
-
285
-
286
-
287
-
288
-
289
-
290
-
291
-
292
-
293
-
294
-
295
-
296
-
297
-
298
-
299
-
300
-
301
-
302
-
303
-
304
-
305
-
306
-
307
-
308
-
309
-
310
-
311
-
312
-
313
-
314
-
315
-
316
-
317
-
318
-
319
-
320
-
321
-
322
-
323
-
324
-
325
-
326
-
327
 |
 |

134
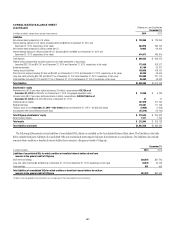
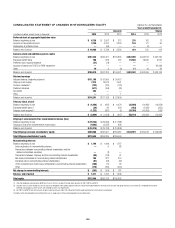
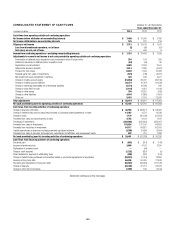
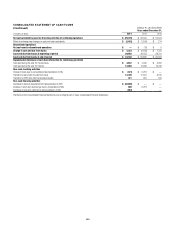
CONSOLIDATED FINANCIAL STATEMENTS
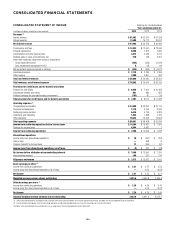
CONSOLIDATED STATEMENT OF INCOME Citigroup Inc. and Subsidiaries
Years ended December 31,
In millions of dollars, except per share amounts 2014 2013 2012
Revenues (1)
Interest revenue $ 61,683 $ 62,970 $ 67,298
Interest expense 13,690 16,177 20,612
Net interest revenue $ 47,993 $ 46,793 $ 46,686
Commissions and fees $ 13,032 $ 12,941 $ 12,584
Principal transactions 6,698 7,302 4,980
Administration and other fiduciary fees 4,013 4,089 4,012
Realized gains on sales of investments, net 570 748 3,251
Other-than-temporary impairment losses on investments
Gross impairment losses (432) (633) (5,037)
Less: Impairments recognized in AOCI 898 66
Net impairment losses recognized in earnings $ (424) $ (535) $ (4,971)
Insurance premiums $ 2,110 $ 2,280 $ 2,395
Other revenue 2,890 2,801 253
Total non-interest revenues $ 28,889 $ 29,626 $ 22,504
Total revenues, net of interest expense $ 76,882 $ 76,419 $ 69,190
Provisions for credit losses and for benefits and claims
Provision for loan losses $ 6,828 $ 7,604 $ 10,458
Policyholder benefits and claims 801 830 887
Provision (release) for unfunded lending commitments (162) 80 (16)
Total provisions for credit losses and for benefits and claims $ 7,467 $ 8,514 $ 11,329
Operating expenses (1)
Compensation and benefits $ 23,959 $ 23,967 $ 25,119
Premises and equipment 3,178 3,165 3,266
Technology/communication 6,436 6,136 5,829
Advertising and marketing 1,844 1,888 2,164
Other operating 19,634 13,252 13,658
Total operating expenses $ 55,051 $ 48,408 $ 50,036
Income from continuing operations before income taxes $ 14,364 $ 19,497 $ 7,825
Provision for income taxes 6,864 5,867 7
Income from continuing operations $ 7,500 $ 13,630 $ 7,818
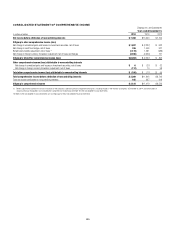
Discontinued operations
Income (loss) from discontinued operations $ 10 $ (242) $ (109)
Gain on sale —268 (1)
Provision (benefit) for income taxes 12 (244) (52)
Income (loss) from discontinued operations, net of taxes $ (2) $ 270 $ (58)
Net income before attribution of noncontrolling interests $ 7,498 $ 13,900 $ 7,760
Noncontrolling interests 185 227 219
Citigroup’s net income $ 7,313 $ 13,673 $ 7,541
Basic earnings per share (2)
Income from continuing operations $ 2.21 $ 4.27 $ 2.53
Income (loss) from discontinued operations, net of taxes —0.09 (0.02)
Net income $ 2.21 $ 4.35 $ 2.51
Weighted average common shares outstanding 3,031.6 3,035.8 2,930.6
Diluted earnings per share (2)
Income from continuing operations $ 2.20 $ 4.26 $ 2.46
Income (loss) from discontinued operations, net of taxes —0.09 (0.02)
Net income $ 2.20 $ 4.35 $ 2.44
Adjusted weighted average common shares outstanding 3,037.0 3,041.6 3,015.5
(1) Certain prior-period revenue and expense lines and totals were reclassified to conform to the current period’s presentation. See Note 3 to the Consolidated Financial Statements.
(2) Due to rounding, earnings per share on continuing operations and discontinued operations may not sum to earnings per share on net income.
The Notes to the Consolidated Financial Statements are an integral part of these Consolidated Financial Statements.