Citibank 2014 Annual Report Download - page 300
Download and view the complete annual report
Please find page 300 of the 2014 Citibank annual report below. You can navigate through the pages in the report by either clicking on the pages listed below, or by using the keyword search tool below to find specific information within the annual report.-
 1
1 -
2
-
3
-
4
-
5
-
6
-
7
-
8
-
9
-
10
-
11
-
12
-
13
-
14
-
15
-
16
-
17
-
18
-
19
-
20
-
21
-
22
-
23
-
24
-
25
-
26
-
27
-
28
-
29
-
30
-
31
-
32
-
33
-
34
-
35
-
36
-
37
-
38
-
39
-
40
-
41
-
42
-
43
-
44
-
45
-
46
-
47
-
48
-
49
-
50
-
51
-
52
-
53
-
54
-
55
-
56
-
57
-
58
-
59
-
60
-
61
-
62
-
63
-
64
-
65
-
66
-
67
-
68
-
69
-
70
-
71
-
72
-
73
-
74
-
75
-
76
-
77
-
78
-
79
-
80
-
81
-
82
-
83
-
84
-
85
-
86
-
87
-
88
-
89
-
90
-
91
-
92
-
93
-
94
-
95
-
96
-
97
-
98
-
99
-
100
-
101
-
102
-
103
-
104
-
105
-
106
-
107
-
108
-
109
-
110
-
111
-
112
-
113
-
114
-
115
-
116
-
117
-
118
-
119
-
120
-
121
-
122
-
123
-
124
-
125
-
126
-
127
-
128
-
129
-
130
-
131
-
132
-
133
-
134
-
135
-
136
-
137
-
138
-
139
-
140
-
141
-
142
-
143
-
144
-
145
-
146
-
147
-
148
-
149
-
150
-
151
-
152
-
153
-
154
-
155
-
156
-
157
-
158
-
159
-
160
-
161
-
162
-
163
-
164
-
165
-
166
-
167
-
168
-
169
-
170
-
171
-
172
-
173
-
174
-
175
-
176
-
177
-
178
-
179
-
180
-
181
-
182
-
183
-
184
-
185
-
186
-
187
-
188
-
189
-
190
-
191
-
192
-
193
-
194
-
195
-
196
-
197
-
198
-
199
-
200
-
201
-
202
-
203
-
204
-
205
-
206
-
207
-
208
-
209
-
210
-
211
-
212
-
213
-
214
-
215
-
216
-
217
-
218
-
219
-
220
-
221
-
222
-
223
-
224
-
225
-
226
-
227
-
228
-
229
-
230
-
231
-
232
-
233
-
234
-
235
-
236
-
237
-
238
-
239
-
240
-
241
-
242
-
243
-
244
-
245
-
246
-
247
-
248
-
249
-
250
-
251
-
252
-
253
-
254
-
255
-
256
-
257
-
258
-
259
-
260
-
261
-
262
-
263
-
264
-
265
-
266
-
267
-
268
-
269
-
270
-
271
-
272
-
273
-
274
-
275
-
276
-
277
-
278
-
279
-
280
-
281
-
282
-
283
-
284
-
285
-
286
-
287
-
288
-
289
-
 290
290 -
 291
291 -
 292
292 -
 293
293 -
 294
294 -
 295
295 -
 296
296 -
 297
297 -
 298
298 -
 299
299 -
 300
300 -
 301
301 -
 302
302 -
 303
303 -
 304
304 -
 305
305 -
 306
306 -
 307
307 -
 308
308 -
 309
309 -
 310
310 -
311
-
312
-
313
-
314
-
315
-
316
-
317
-
318
-
319
-
320
-
321
-
322
-
323
-
324
-
325
-
326
-
327
 |
 |

283
27. PLEDGED ASSETS, COLLATERAL, GUARANTEES
AND COMMITMENTS
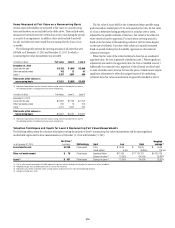
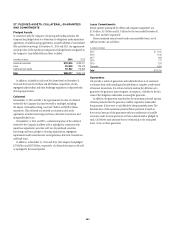
Pledged Assets
In connection with the Company’s financing and trading activities, the
Company has pledged assets to collateralize its obligations under repurchase
agreements, secured financing agreements, secured liabilities of consolidated
VIEs and other borrowings. At December 31, 2014 and 2013, the approximate
carrying values of the significant components of pledged assets recognized on
the Company’s Consolidated Balance Sheet included:
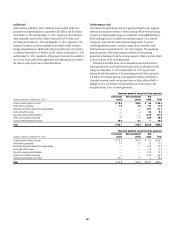
In millions of dollars 2014 2013
Investment securities $173,015 $183,071
Loans 214,530 228,513
Trading account assets 111,832 118,832
Total $499,377 $530,416
In addition, included in Cash and due from banks at December 31,
2014 and 2013 were $6.2 billion and $8.8 billion, respectively, of cash
segregated under federal and other brokerage regulations or deposited with
clearing organizations.
Collateral
At December 31, 2014 and 2013, the approximate fair value of collateral
received by the Company that may be resold or repledged, excluding
the impact of allowable netting, was $346.7 billion and $308.3 billion,
respectively. This collateral was received in connection with resale
agreements, securities borrowings and loans, derivative transactions and
margined broker loans.
At December 31, 2014 and 2013, a substantial portion of the collateral
received by the Company had been sold or repledged in connection with
repurchase agreements, securities sold, not yet purchased, securities
borrowings and loans, pledges to clearing organizations, segregation
requirements under securities laws and regulations, derivative transactions
and bank loans.
In addition, at December 31, 2014 and 2013, the Company had pledged
$376 billion and $397 billion, respectively, of collateral that may not be sold
or repledged by the secured parties.
Lease Commitments
Rental expense (principally for offices and computer equipment) was
$1.4 billion, $1.5 billion and $1.5 billion for the years ended December 31,
2014, 2013 and 2012 respectively.
Future minimum annual rentals under noncancelable leases, net of
sublease income, are as follows:
In millions of dollars
2015 $ 1,415
2016 1,192
2017 964
2018 771
2019 679
Thereafter 4,994
Total $10,015
Guarantees
Citi provides a variety of guarantees and indemnifications to its customers
to enhance their credit standing and enable them to complete a wide variety
of business transactions. For certain contracts meeting the definition of a
guarantee, the guarantor must recognize, at inception, a liability for the fair
value of the obligation undertaken in issuing the guarantee.
In addition, the guarantor must disclose the maximum potential amount
of future payments that the guarantor could be required to make under
the guarantee, if there were a total default by the guaranteed parties. The
determination of the maximum potential future payments is based on
the notional amount of the guarantees without consideration of possible
recoveries under recourse provisions or from collateral held or pledged. As
such, Citi believes such amounts bear no relationship to the anticipated
losses, if any, on these guarantees.