Citibank 2014 Annual Report Download - page 245
Download and view the complete annual report
Please find page 245 of the 2014 Citibank annual report below. You can navigate through the pages in the report by either clicking on the pages listed below, or by using the keyword search tool below to find specific information within the annual report.-
 1
1 -
2
-
3
-
4
-
5
-
6
-
7
-
8
-
9
-
10
-
11
-
12
-
13
-
14
-
15
-
16
-
17
-
18
-
19
-
20
-
21
-
22
-
23
-
24
-
25
-
26
-
27
-
28
-
29
-
30
-
31
-
32
-
33
-
34
-
35
-
36
-
37
-
38
-
39
-
40
-
41
-
42
-
43
-
44
-
45
-
46
-
47
-
48
-
49
-
50
-
51
-
52
-
53
-
54
-
55
-
56
-
57
-
58
-
59
-
60
-
61
-
62
-
63
-
64
-
65
-
66
-
67
-
68
-
69
-
70
-
71
-
72
-
73
-
74
-
75
-
76
-
77
-
78
-
79
-
80
-
81
-
82
-
83
-
84
-
85
-
86
-
87
-
88
-
89
-
90
-
91
-
92
-
93
-
94
-
95
-
96
-
97
-
98
-
99
-
100
-
101
-
102
-
103
-
104
-
105
-
106
-
107
-
108
-
109
-
110
-
111
-
112
-
113
-
114
-
115
-
116
-
117
-
118
-
119
-
120
-
121
-
122
-
123
-
124
-
125
-
126
-
127
-
128
-
129
-
130
-
131
-
132
-
133
-
134
-
135
-
136
-
137
-
138
-
139
-
140
-
141
-
142
-
143
-
144
-
145
-
146
-
147
-
148
-
149
-
150
-
151
-
152
-
153
-
154
-
155
-
156
-
157
-
158
-
159
-
160
-
161
-
162
-
163
-
164
-
165
-
166
-
167
-
168
-
169
-
170
-
171
-
172
-
173
-
174
-
175
-
176
-
177
-
178
-
179
-
180
-
181
-
182
-
183
-
184
-
185
-
186
-
187
-
188
-
189
-
190
-
191
-
192
-
193
-
194
-
195
-
196
-
197
-
198
-
199
-
200
-
201
-
202
-
203
-
204
-
205
-
206
-
207
-
208
-
209
-
210
-
211
-
212
-
213
-
214
-
215
-
216
-
217
-
218
-
219
-
220
-
221
-
222
-
223
-
224
-
225
-
226
-
227
-
228
-
229
-
230
-
231
-
232
-
233
-
234
-
 235
235 -
 236
236 -
 237
237 -
 238
238 -
 239
239 -
 240
240 -
 241
241 -
 242
242 -
 243
243 -
 244
244 -
 245
245 -
 246
246 -
 247
247 -
 248
248 -
 249
249 -
 250
250 -
 251
251 -
 252
252 -
 253
253 -
 254
254 -
 255
255 -
256
-
257
-
258
-
259
-
260
-
261
-
262
-
263
-
264
-
265
-
266
-
267
-
268
-
269
-
270
-
271
-
272
-
273
-
274
-
275
-
276
-
277
-
278
-
279
-
280
-
281
-
282
-
283
-
284
-
285
-
286
-
287
-
288
-
289
-
290
-
291
-
292
-
293
-
294
-
295
-
296
-
297
-
298
-
299
-
300
-
301
-
302
-
303
-
304
-
305
-
306
-
307
-
308
-
309
-
310
-
311
-
312
-
313
-
314
-
315
-
316
-
317
-
318
-
319
-
320
-
321
-
322
-
323
-
324
-
325
-
326
-
327
 |
 |

228
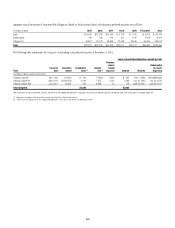
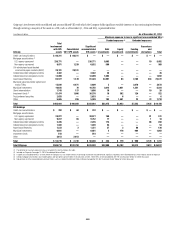
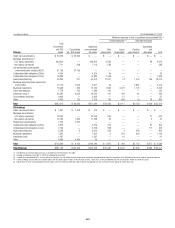
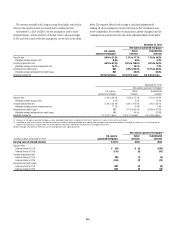
Citigroup’s involvement with consolidated and unconsolidated VIEs with which the Company holds significant variable interests or has continuing involvement
through servicing a majority of the assets in a VIE, each as of December 31, 2014 and 2013, is presented below:
In millions of dollars As of December 31, 2014
Maximum exposure to loss in significant unconsolidated VIEs (1)
Funded exposures (2) Unfunded exposures
Citicorp
Total
involvement
with SPE
assets
Consolidated
VIE / SPE assets
Significant
unconsolidated
VIE assets (3)
Debt
investments
Equity
investments
Funding
commitments
Guarantees
and
derivatives Total
Credit card securitizations $ 60,211 $ 60,211 $ — $ — $ — $ — $ — $ —
Mortgage securitizations (4)
U.S. agency-sponsored 236,771 — 236,771 5,063 — — 19 5,082
Non-agency-sponsored 8,071 1,239 6,832 560 — — — 560
Citi-administered asset-backed
commercial paper conduits (ABCP) 29,181 29,181 — — — — — —
Collateralized debt obligations (CDOs) 3,382 — 3,382 45 — — — 45
Collateralized loan obligations (CLOs) 13,099 — 13,099 1,692 — — — 1,692
Asset-based financing 62,577 1,149 61,428 22,891 63 2,185 333 25,472
Municipal securities tender option bond
trusts (TOBs) 12,280 6,671 5,609 3 — 3,670 — 3,673
Municipal investments 16,825 70 16,755 2,012 2,021 1,321 — 5,354
Client intermediation 1,745 137 1,608 10 — — 10 20
Investment funds (5) 31,474 1,096 30,378 16 382 124 — 522
Trust preferred securities 2,633 — 2,633 — 6 — — 6
Other 5,685 296 5,389 183 1,451 23 73 1,730
Total $483,934 $100,050 $383,884 $32,475 $3,923 $ 7,323 $ 435 $ 44,156
Citi Holdings
Credit card securitizations $ 292 $ 60 $ 232 $ — $ — $ — $ — $ —
Mortgage securitizations
U.S. agency-sponsored 28,077 — 28,077 150 — — 91 241
Non-agency-sponsored 9,817 65 9,752 17 — — 1 18
Collateralized debt obligations (CDOs) 2,235 — 2,235 174 — — 86 260
Collateralized loan obligations (CLOs) 1,020 — 1,020 54 — — — 54
Asset-based financing 1,323 2 1,321 37 3 86 — 126
Municipal investments 6,881 — 6,881 2 176 904 — 1,082
Investment funds 518 — 518 — — — — —
Other 2,613 2,613 — — — — — —
Total $ 52,776 $ 2,740 $ 50,036 $ 434 $ 179 $ 990 $ 178 $ 1,781
Total Citigroup $536,710 $102,790 $433,920 $32,909 $4,102 $ 8,313 $ 613 $ 45,937
(1) The definition of maximum exposure to loss is included in the text that follows this table.
(2) Included on Citigroup’s December 31, 2014 Consolidated Balance Sheet.
(3) A significant unconsolidated VIE is an entity where the Company has any variable interest or continuing involvement considered to be significant, regardless of the likelihood of loss or the notional amount of exposure.
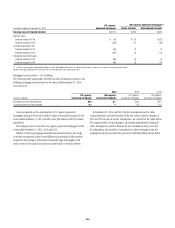
(4) Citicorp mortgage securitizations also include agency and non-agency (private-label) re-securitization activities. These SPEs are not consolidated. See “Re-securitizations” below for further discussion.
(5) Substantially all of the unconsolidated investment funds’ assets are related to retirement funds in Mexico managed by Citi. See “Investment Funds” below for further discussion.