Citibank 2014 Annual Report Download - page 186
Download and view the complete annual report
Please find page 186 of the 2014 Citibank annual report below. You can navigate through the pages in the report by either clicking on the pages listed below, or by using the keyword search tool below to find specific information within the annual report.-
 1
1 -
2
-
3
-
4
-
5
-
6
-
7
-
8
-
9
-
10
-
11
-
12
-
13
-
14
-
15
-
16
-
17
-
18
-
19
-
20
-
21
-
22
-
23
-
24
-
25
-
26
-
27
-
28
-
29
-
30
-
31
-
32
-
33
-
34
-
35
-
36
-
37
-
38
-
39
-
40
-
41
-
42
-
43
-
44
-
45
-
46
-
47
-
48
-
49
-
50
-
51
-
52
-
53
-
54
-
55
-
56
-
57
-
58
-
59
-
60
-
61
-
62
-
63
-
64
-
65
-
66
-
67
-
68
-
69
-
70
-
71
-
72
-
73
-
74
-
75
-
76
-
77
-
78
-
79
-
80
-
81
-
82
-
83
-
84
-
85
-
86
-
87
-
88
-
89
-
90
-
91
-
92
-
93
-
94
-
95
-
96
-
97
-
98
-
99
-
100
-
101
-
102
-
103
-
104
-
105
-
106
-
107
-
108
-
109
-
110
-
111
-
112
-
113
-
114
-
115
-
116
-
117
-
118
-
119
-
120
-
121
-
122
-
123
-
124
-
125
-
126
-
127
-
128
-
129
-
130
-
131
-
132
-
133
-
134
-
135
-
136
-
137
-
138
-
139
-
140
-
141
-
142
-
143
-
144
-
145
-
146
-
147
-
148
-
149
-
150
-
151
-
152
-
153
-
154
-
155
-
156
-
157
-
158
-
159
-
160
-
161
-
162
-
163
-
164
-
165
-
166
-
167
-
168
-
169
-
170
-
171
-
172
-
173
-
174
-
175
-
 176
176 -
 177
177 -
 178
178 -
 179
179 -
 180
180 -
 181
181 -
 182
182 -
 183
183 -
 184
184 -
 185
185 -
 186
186 -
 187
187 -
 188
188 -
 189
189 -
 190
190 -
 191
191 -
 192
192 -
 193
193 -
 194
194 -
 195
195 -
 196
196 -
197
-
198
-
199
-
200
-
201
-
202
-
203
-
204
-
205
-
206
-
207
-
208
-
209
-
210
-
211
-
212
-
213
-
214
-
215
-
216
-
217
-
218
-
219
-
220
-
221
-
222
-
223
-
224
-
225
-
226
-
227
-
228
-
229
-
230
-
231
-
232
-
233
-
234
-
235
-
236
-
237
-
238
-
239
-
240
-
241
-
242
-
243
-
244
-
245
-
246
-
247
-
248
-
249
-
250
-
251
-
252
-
253
-
254
-
255
-
256
-
257
-
258
-
259
-
260
-
261
-
262
-
263
-
264
-
265
-
266
-
267
-
268
-
269
-
270
-
271
-
272
-
273
-
274
-
275
-
276
-
277
-
278
-
279
-
280
-
281
-
282
-
283
-
284
-
285
-
286
-
287
-
288
-
289
-
290
-
291
-
292
-
293
-
294
-
295
-
296
-
297
-
298
-
299
-
300
-
301
-
302
-
303
-
304
-
305
-
306
-
307
-
308
-
309
-
310
-
311
-
312
-
313
-
314
-
315
-
316
-
317
-
318
-
319
-
320
-
321
-
322
-
323
-
324
-
325
-
326
-
327
 |
 |

169
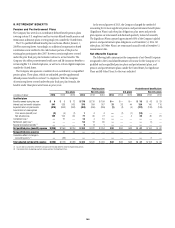
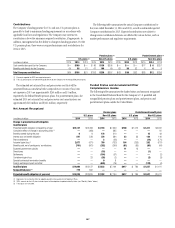
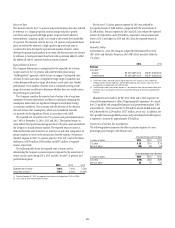
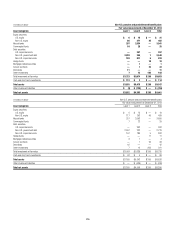
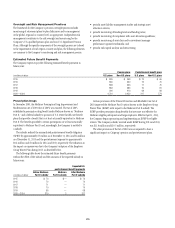
The following table shows the change in Accumulated other
comprehensive income (loss) related to Citi’s pension and postretirement
benefit plans (for Significant Plans and All Other Plans) for the
years indicated.
In millions of dollars 2014 2013 2012
Beginning of period balance, net of tax (1)(2) $(3,989) $(5,270) $(4,282)
Cumulative effect of change in accounting policy (3) —(22) —
Actuarial assumptions changes
and plan experience (4) (3,404) 2,380 (2,400)
Net asset gain (loss) due to difference
between actual and expected returns 833 (1,084) 963
Net amortizations 202 271 214
Prior service credit 13 360 —
Curtailment/settlement loss (5) 67 — —
Foreign exchange impact and other 459 74 (155)
Change in deferred taxes, net 660 (698) 390
Change, net of tax $(1,170) $ 1,281 $ (988)
End of period balance, net of tax (1)(2) $(5,159) $(3,989) $(5,270)
(1) See Note 20 to the Consolidated Financial Statements for further discussion of net Accumulated other
comprehensive income (loss) balance.
(2) Includes net-of-tax amounts for certain profit sharing plans outside the U.S.
(3) Represents the cumulative effect of adopting quarterly remeasurement for Significant Plans.
(4) Includes $111 million, $(58) million and $62 million of actuarial losses (gains) related to the
U.S. nonqualified pension plans for 2014, 2013 and 2012, respectively.
(5) Curtailment and settlement losses relate to repositioning actions.
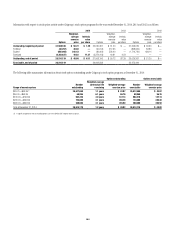
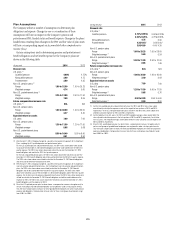
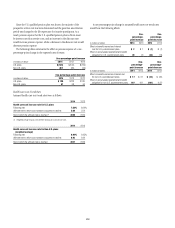
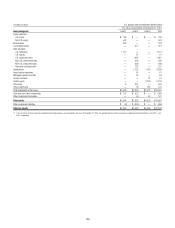
At December 31, 2014 and 2013, for both qualified and nonqualified
pension plans and for both funded and unfunded plans, the aggregate
projected benefit obligation (PBO), the aggregate accumulated benefit
obligation (ABO), and the aggregate fair value of plan assets are presented
for pension plans with a projected benefit obligation in excess of plan assets
and for pension plans with an accumulated benefit obligation in excess of
plan assets as follows:
PBO exceeds fair value of plan assets ABO exceeds fair value plan assets
U.S. plans (1) Non-U.S. plans (2) U.S. plans (1) Non-U.S. plans (2)
In millions of dollars 2014 2013 2014 2013 2014 2013 2014 2013
Projected benefit obligation $14,839 $692 $2,756 $2,765 $14,839 $692 $2,570 $2,408
Accumulated benefit obligation 14,821 668 2,353 2,375 14,821 668 2,233 2,090
Fair value of plan assets 13,071 —1,640 1,780 13,071 —1,495 1,468
(1) At December 31, 2014, for both the U.S. qualified and nonqualified plans, the aggregate PBO and the aggregate ABO exceeded plan assets. At December 31, 2013, assets for the U.S. qualified plan exceeded both the
PBO and ABO. The U.S. nonqualified plans are not funded and thus the PBO and ABO exceeded plan assets as of this date.
(2) At December 31, 2014, the aggregate PBO and the aggregate ABO exceeded the aggregate plan assets for non-U.S. plans. Assets for certain non-U.S. plans exceed both the PBO and ABO and, as such, only the
aggregate PBO, ABO, and asset values for underfunded non-U.S. plans are presented in the table above.
At December 31, 2014, combined accumulated benefit obligations for
the U.S. and non-U.S. pension plans, excluding U.S. nonqualified plans,
were more than plan assets by $0.6 billion. At December 31, 2013, combined
accumulated benefit obligations for the U.S. and non-U.S. pension plans,
excluding U.S. nonqualified plans, were less than plan assets by $0.9 billion.