Citibank 2014 Annual Report Download - page 272
Download and view the complete annual report
Please find page 272 of the 2014 Citibank annual report below. You can navigate through the pages in the report by either clicking on the pages listed below, or by using the keyword search tool below to find specific information within the annual report.-
 1
1 -
2
-
3
-
4
-
5
-
6
-
7
-
8
-
9
-
10
-
11
-
12
-
13
-
14
-
15
-
16
-
17
-
18
-
19
-
20
-
21
-
22
-
23
-
24
-
25
-
26
-
27
-
28
-
29
-
30
-
31
-
32
-
33
-
34
-
35
-
36
-
37
-
38
-
39
-
40
-
41
-
42
-
43
-
44
-
45
-
46
-
47
-
48
-
49
-
50
-
51
-
52
-
53
-
54
-
55
-
56
-
57
-
58
-
59
-
60
-
61
-
62
-
63
-
64
-
65
-
66
-
67
-
68
-
69
-
70
-
71
-
72
-
73
-
74
-
75
-
76
-
77
-
78
-
79
-
80
-
81
-
82
-
83
-
84
-
85
-
86
-
87
-
88
-
89
-
90
-
91
-
92
-
93
-
94
-
95
-
96
-
97
-
98
-
99
-
100
-
101
-
102
-
103
-
104
-
105
-
106
-
107
-
108
-
109
-
110
-
111
-
112
-
113
-
114
-
115
-
116
-
117
-
118
-
119
-
120
-
121
-
122
-
123
-
124
-
125
-
126
-
127
-
128
-
129
-
130
-
131
-
132
-
133
-
134
-
135
-
136
-
137
-
138
-
139
-
140
-
141
-
142
-
143
-
144
-
145
-
146
-
147
-
148
-
149
-
150
-
151
-
152
-
153
-
154
-
155
-
156
-
157
-
158
-
159
-
160
-
161
-
162
-
163
-
164
-
165
-
166
-
167
-
168
-
169
-
170
-
171
-
172
-
173
-
174
-
175
-
176
-
177
-
178
-
179
-
180
-
181
-
182
-
183
-
184
-
185
-
186
-
187
-
188
-
189
-
190
-
191
-
192
-
193
-
194
-
195
-
196
-
197
-
198
-
199
-
200
-
201
-
202
-
203
-
204
-
205
-
206
-
207
-
208
-
209
-
210
-
211
-
212
-
213
-
214
-
215
-
216
-
217
-
218
-
219
-
220
-
221
-
222
-
223
-
224
-
225
-
226
-
227
-
228
-
229
-
230
-
231
-
232
-
233
-
234
-
235
-
236
-
237
-
238
-
239
-
240
-
241
-
242
-
243
-
244
-
245
-
246
-
247
-
248
-
249
-
250
-
251
-
252
-
253
-
254
-
255
-
256
-
257
-
258
-
259
-
260
-
261
-
 262
262 -
 263
263 -
 264
264 -
 265
265 -
 266
266 -
 267
267 -
 268
268 -
 269
269 -
 270
270 -
 271
271 -
 272
272 -
 273
273 -
 274
274 -
 275
275 -
 276
276 -
 277
277 -
 278
278 -
 279
279 -
 280
280 -
 281
281 -
 282
282 -
283
-
284
-
285
-
286
-
287
-
288
-
289
-
290
-
291
-
292
-
293
-
294
-
295
-
296
-
297
-
298
-
299
-
300
-
301
-
302
-
303
-
304
-
305
-
306
-
307
-
308
-
309
-
310
-
311
-
312
-
313
-
314
-
315
-
316
-
317
-
318
-
319
-
320
-
321
-
322
-
323
-
324
-
325
-
326
-
327
 |
 |

255
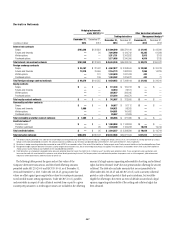
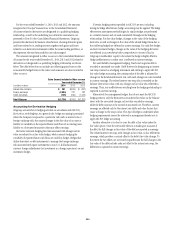
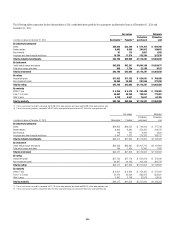
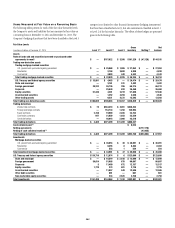
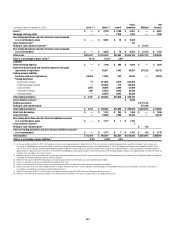
The following tables summarize the key characteristics of Citi’s credit derivatives portfolio by counterparty and derivative form as of December 31, 2014 and
December 31, 2013:
Fair values Notionals
In millions of dollars at December 31, 2014 Receivable (1) Payable (2)
Protection
purchased
Protection
sold
By industry/counterparty
Banks $24,828 $23,189 $ 574,764 $ 604,700
Broker-dealers 8,093 9,309 204,542 199,693
Non-financial 91 113 3,697 1,595
Insurance and other financial institutions 10,784 11,374 333,384 257,870
Total by industry/counterparty $43,796 $43,985 $1,116,387 $1,063,858
By instrument
Credit default swaps and options $42,930 $42,201 $1,094,199 $1,054,671
Total return swaps and other 866 1,784 22,188 9,187
Total by instrument $43,796 $43,985 $1,116,387 $1,063,858
By rating
Investment grade $17,432 $17,182 $ 824,831 $ 786,848
Non-investment grade 26,364 26,803 291,556 277,010
Total by rating $43,796 $43,985 $1,116,387 $1,063,858
By maturity
Within 1 year $ 4,356 $ 4,278 $ 250,489 $ 229,502
From 1 to 5 years 34,692 35,160 790,251 772,001
After 5 years 4,748 4,547 75,647 62,355
Total by maturity $43,796 $43,985 $1,116,387 $1,063,858
(1) The fair value amount receivable is composed of $18,708 million under protection purchased and $25,088 million under protection sold.
(2) The fair value amount payable is composed of $26,527 million under protection purchased and $17,458 million under protection sold.
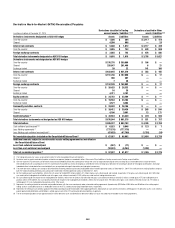
Fair values Notionals
In millions of dollars at December 31, 2013 Receivable (1) Payable (2)
Protection
purchased
Protection
sold
By industry/counterparty
Banks $24,992 $23,455 $ 739,646 $ 727,748
Broker-dealers 8,840 9,820 254,250 224,073
Non-financial 138 162 4,930 2,820
Insurance and other financial institutions 6,447 7,922 216,236 188,722
Total by industry/counterparty $40,417 $41,359 $1,215,062 $1,143,363
By instrument
Credit default swaps and options $40,233 $39,930 $1,201,716 $1,141,864
Total return swaps and other 184 1,429 13,346 1,499
Total by instrument $40,417 $41,359 $1,215,062 $1,143,363
By rating
Investment grade $17,150 $17,174 $ 812,918 $ 752,640
Non-investment grade 23,267 24,185 402,144 390,723
Total by rating $40,417 $41,359 $1,215,062 $1,143,363
By maturity
Within 1 year $ 2,901 $ 3,262 $ 254,305 $ 221,562
From 1 to 5 years 31,674 32,349 883,879 853,391
After 5 years 5,842 5,748 76,878 68,410
Total by maturity $40,417 $41,359 $1,215,062 $1,143,363
(1) The fair value amount receivable is composed of $13,744 million under protection purchased and $26,673 million under protection sold.
(2) The fair value amount payable is composed of $28,723 million under protection purchased and $12,636 million under protection sold.