Citibank 2014 Annual Report Download - page 42
Download and view the complete annual report
Please find page 42 of the 2014 Citibank annual report below. You can navigate through the pages in the report by either clicking on the pages listed below, or by using the keyword search tool below to find specific information within the annual report.-
 1
1 -
2
-
3
-
4
-
5
-
6
-
7
-
8
-
9
-
10
-
11
-
12
-
13
-
14
-
15
-
16
-
17
-
18
-
19
-
20
-
21
-
22
-
23
-
24
-
25
-
26
-
27
-
28
-
29
-
30
-
31
-
 32
32 -
 33
33 -
 34
34 -
 35
35 -
 36
36 -
 37
37 -
 38
38 -
 39
39 -
 40
40 -
 41
41 -
 42
42 -
 43
43 -
 44
44 -
 45
45 -
 46
46 -
 47
47 -
 48
48 -
 49
49 -
 50
50 -
 51
51 -
 52
52 -
53
-
54
-
55
-
56
-
57
-
58
-
59
-
60
-
61
-
62
-
63
-
64
-
65
-
66
-
67
-
68
-
69
-
70
-
71
-
72
-
73
-
74
-
75
-
76
-
77
-
78
-
79
-
80
-
81
-
82
-
83
-
84
-
85
-
86
-
87
-
88
-
89
-
90
-
91
-
92
-
93
-
94
-
95
-
96
-
97
-
98
-
99
-
100
-
101
-
102
-
103
-
104
-
105
-
106
-
107
-
108
-
109
-
110
-
111
-
112
-
113
-
114
-
115
-
116
-
117
-
118
-
119
-
120
-
121
-
122
-
123
-
124
-
125
-
126
-
127
-
128
-
129
-
130
-
131
-
132
-
133
-
134
-
135
-
136
-
137
-
138
-
139
-
140
-
141
-
142
-
143
-
144
-
145
-
146
-
147
-
148
-
149
-
150
-
151
-
152
-
153
-
154
-
155
-
156
-
157
-
158
-
159
-
160
-
161
-
162
-
163
-
164
-
165
-
166
-
167
-
168
-
169
-
170
-
171
-
172
-
173
-
174
-
175
-
176
-
177
-
178
-
179
-
180
-
181
-
182
-
183
-
184
-
185
-
186
-
187
-
188
-
189
-
190
-
191
-
192
-
193
-
194
-
195
-
196
-
197
-
198
-
199
-
200
-
201
-
202
-
203
-
204
-
205
-
206
-
207
-
208
-
209
-
210
-
211
-
212
-
213
-
214
-
215
-
216
-
217
-
218
-
219
-
220
-
221
-
222
-
223
-
224
-
225
-
226
-
227
-
228
-
229
-
230
-
231
-
232
-
233
-
234
-
235
-
236
-
237
-
238
-
239
-
240
-
241
-
242
-
243
-
244
-
245
-
246
-
247
-
248
-
249
-
250
-
251
-
252
-
253
-
254
-
255
-
256
-
257
-
258
-
259
-
260
-
261
-
262
-
263
-
264
-
265
-
266
-
267
-
268
-
269
-
270
-
271
-
272
-
273
-
274
-
275
-
276
-
277
-
278
-
279
-
280
-
281
-
282
-
283
-
284
-
285
-
286
-
287
-
288
-
289
-
290
-
291
-
292
-
293
-
294
-
295
-
296
-
297
-
298
-
299
-
300
-
301
-
302
-
303
-
304
-
305
-
306
-
307
-
308
-
309
-
310
-
311
-
312
-
313
-
314
-
315
-
316
-
317
-
318
-
319
-
320
-
321
-
322
-
323
-
324
-
325
-
326
-
327
 |
 |

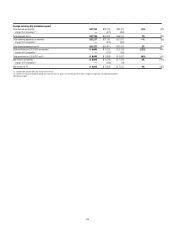
25
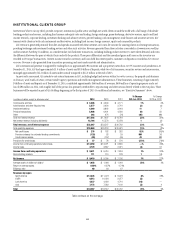
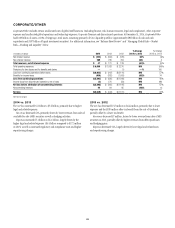
Income from continuing operations by region
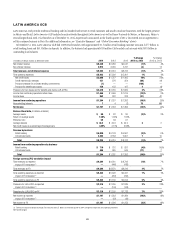
North America $ 3,896 $ 3,143 $ 1,598 24% 97%
EMEA 1,984 2,432 2,467 (18) (1)
Latin America 1,337 1,628 1,879 (18) (13)
Asia 2,304 2,211 1,890 417
Total $ 9,521 $ 9,414 $ 7,834 1% 20%
Average loans by region (in billions of dollars)
North America $ 111 $ 98 $ 83 13% 18%
EMEA 58 55 53 54
Latin America 40 38 35 59
Asia 68 65 63 53
Total $ 277 $ 256 $ 234 8% 9%
EOP deposits by business (in billions of dollars)
Treasury and trade solutions $ 380 $ 380 $ 325 —17%
All other ICG businesses 179 194 199 (8) (3)
Total $ 559 $ 574 $ 524 (3)% 10%
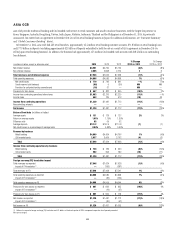
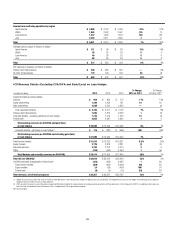
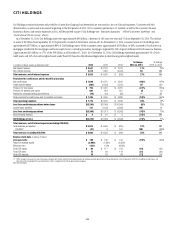
ICG Revenue Details—Excluding CVA/DVA and Gain/(Loss) on Loan Hedges
In millions of dollars 2014 2013 2012
% Change
2014 vs. 2013
% Change
2013 vs. 2012
Investment banking revenue details
Advisory $ 949 $ 852 $ 715 11% 19%
Equity underwriting 1,246 1,059 731 18 45
Debt underwriting 2,508 2,500 2,656 —(6)
Total investment banking $ 4,703 $ 4,411 $ 4,102 7% 8%
Treasury and trade solutions 7,882 7,819 8,026 1(3)
Corporate lending - excluding gain/(loss) on loan hedges 1,742 1,513 1,576 15 (4)
Private bank 2,653 2,487 2,394 74
Total banking revenues (ex-CVA/DVA and gain/(loss)
on loan hedges) $ 16,980 $ 16,230 $ 16,098 5% 1%
Corporate lending - gain/(loss) on loan hedges (1) $ 116 $ (287) $ (698) NM 59%
Total banking revenues (ex-CVA/DVA and including gain/(loss)
on loan hedges) $ 17,096 $ 15,943 $ 15,400 7% 4%
Fixed income markets $ 11,815 $ 13,322 $ 14,361 (11)% (7)%
Equity markets 2,776 2,818 2,281 (1) 24
Securities services 2,333 2,272 2,214 33
Other (410) (443) (1,007) 756
Total Markets and securities services (ex-CVA/DVA) $ 16,514 $ 17,969 $ 17,849 (8)% 1%
Total ICG (ex-CVA/DVA) $ 33,610 $ 33,912 $ 33,249 (1)% 2%
CVA/DVA (excluded as applicable in lines above) (2) (343) (345) (2,487) 186
Fixed income markets (359) (300) (2,048) (20) 85
Equity markets 24 (39) (424) NM 91
Private bank (8) (6) (15) (33) 60
Total revenues, net of interest expense $ 33,267 $ 33,567 $ 30,762 (1)% 9%
(1) Hedges on accrual loans reflect the mark-to-market on credit derivatives used to economically hedge the corporate loan accrual portfolio. The fixed premium costs of these hedges are netted against the corporate
lending revenues to reflect the cost of credit protection.
(2) 2014 includes the impact of a one-time pretax charge of $430 million related to the implementation of funding valuation adjustments (FVA) on derivatives in the third quarter of 2014. For additional information, see
Note 25 to the Consolidated Financial Statements. FVA is included within CVA for presentation purposes.
NM Not meaningful