Citibank 2014 Annual Report Download - page 288
Download and view the complete annual report
Please find page 288 of the 2014 Citibank annual report below. You can navigate through the pages in the report by either clicking on the pages listed below, or by using the keyword search tool below to find specific information within the annual report.-
 1
1 -
2
-
3
-
4
-
5
-
6
-
7
-
8
-
9
-
10
-
11
-
12
-
13
-
14
-
15
-
16
-
17
-
18
-
19
-
20
-
21
-
22
-
23
-
24
-
25
-
26
-
27
-
28
-
29
-
30
-
31
-
32
-
33
-
34
-
35
-
36
-
37
-
38
-
39
-
40
-
41
-
42
-
43
-
44
-
45
-
46
-
47
-
48
-
49
-
50
-
51
-
52
-
53
-
54
-
55
-
56
-
57
-
58
-
59
-
60
-
61
-
62
-
63
-
64
-
65
-
66
-
67
-
68
-
69
-
70
-
71
-
72
-
73
-
74
-
75
-
76
-
77
-
78
-
79
-
80
-
81
-
82
-
83
-
84
-
85
-
86
-
87
-
88
-
89
-
90
-
91
-
92
-
93
-
94
-
95
-
96
-
97
-
98
-
99
-
100
-
101
-
102
-
103
-
104
-
105
-
106
-
107
-
108
-
109
-
110
-
111
-
112
-
113
-
114
-
115
-
116
-
117
-
118
-
119
-
120
-
121
-
122
-
123
-
124
-
125
-
126
-
127
-
128
-
129
-
130
-
131
-
132
-
133
-
134
-
135
-
136
-
137
-
138
-
139
-
140
-
141
-
142
-
143
-
144
-
145
-
146
-
147
-
148
-
149
-
150
-
151
-
152
-
153
-
154
-
155
-
156
-
157
-
158
-
159
-
160
-
161
-
162
-
163
-
164
-
165
-
166
-
167
-
168
-
169
-
170
-
171
-
172
-
173
-
174
-
175
-
176
-
177
-
178
-
179
-
180
-
181
-
182
-
183
-
184
-
185
-
186
-
187
-
188
-
189
-
190
-
191
-
192
-
193
-
194
-
195
-
196
-
197
-
198
-
199
-
200
-
201
-
202
-
203
-
204
-
205
-
206
-
207
-
208
-
209
-
210
-
211
-
212
-
213
-
214
-
215
-
216
-
217
-
218
-
219
-
220
-
221
-
222
-
223
-
224
-
225
-
226
-
227
-
228
-
229
-
230
-
231
-
232
-
233
-
234
-
235
-
236
-
237
-
238
-
239
-
240
-
241
-
242
-
243
-
244
-
245
-
246
-
247
-
248
-
249
-
250
-
251
-
252
-
253
-
254
-
255
-
256
-
257
-
258
-
259
-
260
-
261
-
262
-
263
-
264
-
265
-
266
-
267
-
268
-
269
-
270
-
271
-
272
-
273
-
274
-
275
-
276
-
277
-
 278
278 -
 279
279 -
 280
280 -
 281
281 -
 282
282 -
 283
283 -
 284
284 -
 285
285 -
 286
286 -
 287
287 -
 288
288 -
 289
289 -
 290
290 -
 291
291 -
 292
292 -
 293
293 -
 294
294 -
 295
295 -
 296
296 -
 297
297 -
 298
298 -
299
-
300
-
301
-
302
-
303
-
304
-
305
-
306
-
307
-
308
-
309
-
310
-
311
-
312
-
313
-
314
-
315
-
316
-
317
-
318
-
319
-
320
-
321
-
322
-
323
-
324
-
325
-
326
-
327
 |
 |

271
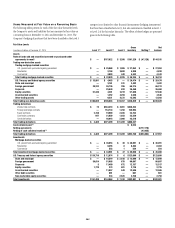
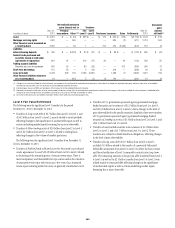
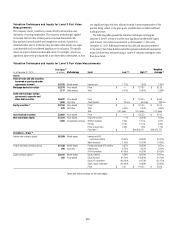
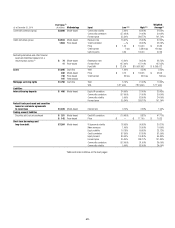
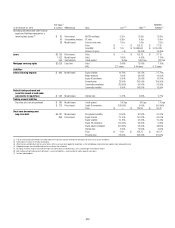
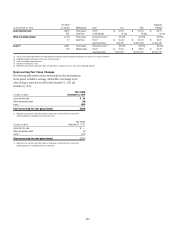
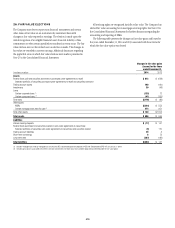
As of December 31, 2014
Fair Value
(in millions)
(1)
Methodology Input Low (2)(3) High (2)(3)
Weighted
Average (4)
Commodity contracts (gross) $3,606 Model-based Commodity volatility 5.00% 83.00% 24.00%
Commodity correlation (57.00)% 91.00% 30.00%
Forward price 35.34% 268.77% 101.74%
Credit derivatives (gross) $4,944 Model-based Recovery rate 13.97% 75.00% 37.62%
1,584 Price-based Credit correlation —% 95.00% 58.76%
Price $ 1.00 $ 144.50 $ 53.86
Credit spread 1 bps 3,380 bps 180 bps
Upfront points 0.39 100.00 52.26
Nontrading derivatives and other financial
assets and liabilities measured on a
recurring basis (gross) (6) $ 74 Model-based Redemption rate 13.00% 99.50% 68.73%
11 Price-based Forward Price 107.00% 107.10% 107.05%
Fund NAV $ 12,974 $10,087,963 $ 9,308,012
Loans $1,095 Cash flow Yield 1.60% 4.50% 2.23%
832 Model-based Price $ 4.72 $ 106.55 $ 98.56
740 Price-based Credit spread 35 bps 500 bps 199 bps
441 Yield analysis
Mortgage servicing rights $1,750 Cash flow Yield 5.19% 21.40% 10.25%
WAL 3.31 years 7.89 years 5.17 years
Liabilities
Interest-bearing deposits $ 486 Model-based Equity-IR correlation 34.00% 37.00% 35.43%
Commodity correlation (57.00)% 91.00% 30.00%
Commodity volatility 5.00% 83.00% 24.00%
Forward price 35.34% 268.77% 101.74%
Federal funds purchased and securities
loaned or sold under agreements
to repurchase $1,043 Model-based Interest rate 0.74% 2.26% 1.90%
Trading account liabilities
Securities sold, not yet purchased $ 251 Model-based Credit-IR correlation (70.49)% 8.81% 47.17%
$ 142 Price-based Price $ — $ 117.00 $ 70.33
Short-term borrowings and
long-term debt $7,204 Model-based IR lognormal volatility 18.05% 90.65% 30.21%
Mean reversion 1.00% 20.00% 10.50%
Equity volatility 10.18% 69.65% 23.72%
Credit correlation 87.50% 87.50% 87.50%
Equity forward 89.50% 100.80% 95.80%
Forward price 35.34% 268.77% 101.80%
Commodity correlation (57.00)% 91.00% 30.00%
Commodity volatility 5.00% 83.00% 24.00%
Table and notes continue on the next pages.