Citibank 2014 Annual Report Download - page 297
Download and view the complete annual report
Please find page 297 of the 2014 Citibank annual report below. You can navigate through the pages in the report by either clicking on the pages listed below, or by using the keyword search tool below to find specific information within the annual report.-
 1
1 -
2
-
3
-
4
-
5
-
6
-
7
-
8
-
9
-
10
-
11
-
12
-
13
-
14
-
15
-
16
-
17
-
18
-
19
-
20
-
21
-
22
-
23
-
24
-
25
-
26
-
27
-
28
-
29
-
30
-
31
-
32
-
33
-
34
-
35
-
36
-
37
-
38
-
39
-
40
-
41
-
42
-
43
-
44
-
45
-
46
-
47
-
48
-
49
-
50
-
51
-
52
-
53
-
54
-
55
-
56
-
57
-
58
-
59
-
60
-
61
-
62
-
63
-
64
-
65
-
66
-
67
-
68
-
69
-
70
-
71
-
72
-
73
-
74
-
75
-
76
-
77
-
78
-
79
-
80
-
81
-
82
-
83
-
84
-
85
-
86
-
87
-
88
-
89
-
90
-
91
-
92
-
93
-
94
-
95
-
96
-
97
-
98
-
99
-
100
-
101
-
102
-
103
-
104
-
105
-
106
-
107
-
108
-
109
-
110
-
111
-
112
-
113
-
114
-
115
-
116
-
117
-
118
-
119
-
120
-
121
-
122
-
123
-
124
-
125
-
126
-
127
-
128
-
129
-
130
-
131
-
132
-
133
-
134
-
135
-
136
-
137
-
138
-
139
-
140
-
141
-
142
-
143
-
144
-
145
-
146
-
147
-
148
-
149
-
150
-
151
-
152
-
153
-
154
-
155
-
156
-
157
-
158
-
159
-
160
-
161
-
162
-
163
-
164
-
165
-
166
-
167
-
168
-
169
-
170
-
171
-
172
-
173
-
174
-
175
-
176
-
177
-
178
-
179
-
180
-
181
-
182
-
183
-
184
-
185
-
186
-
187
-
188
-
189
-
190
-
191
-
192
-
193
-
194
-
195
-
196
-
197
-
198
-
199
-
200
-
201
-
202
-
203
-
204
-
205
-
206
-
207
-
208
-
209
-
210
-
211
-
212
-
213
-
214
-
215
-
216
-
217
-
218
-
219
-
220
-
221
-
222
-
223
-
224
-
225
-
226
-
227
-
228
-
229
-
230
-
231
-
232
-
233
-
234
-
235
-
236
-
237
-
238
-
239
-
240
-
241
-
242
-
243
-
244
-
245
-
246
-
247
-
248
-
249
-
250
-
251
-
252
-
253
-
254
-
255
-
256
-
257
-
258
-
259
-
260
-
261
-
262
-
263
-
264
-
265
-
266
-
267
-
268
-
269
-
270
-
271
-
272
-
273
-
274
-
275
-
276
-
277
-
278
-
279
-
280
-
281
-
282
-
283
-
284
-
285
-
286
-
 287
287 -
 288
288 -
 289
289 -
 290
290 -
 291
291 -
 292
292 -
 293
293 -
 294
294 -
 295
295 -
 296
296 -
 297
297 -
 298
298 -
 299
299 -
 300
300 -
 301
301 -
 302
302 -
 303
303 -
 304
304 -
 305
305 -
 306
306 -
 307
307 -
308
-
309
-
310
-
311
-
312
-
313
-
314
-
315
-
316
-
317
-
318
-
319
-
320
-
321
-
322
-
323
-
324
-
325
-
326
-
327
 |
 |

280
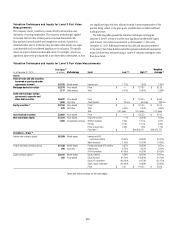
Own Debt Valuation Adjustments
Own debt valuation adjustments are recognized on Citi’s liabilities for which
the fair value option has been elected using Citi’s credit spreads observed in
the bond market. The fair value of liabilities for which the fair value option
is elected (other than non-recourse and similar liabilities) is impacted by
the narrowing or widening of the Company’s credit spreads. The estimated
change in the fair value of these liabilities due to such changes in the
Company’s own credit risk (or instrument-specific credit risk) was a gain of
$218 million and a loss of $412 million for the years ended December 31,
2014 and 2013, respectively. Changes in fair value resulting from changes
in instrument-specific credit risk were estimated by incorporating the
Company’s current credit spreads observable in the bond market into the
relevant valuation technique used to value each liability as described above.
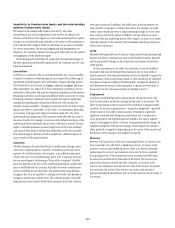
The Fair Value Option for Financial Assets and Financial
Liabilities
Selected portfolios of securities purchased under
agreements to resell, securities borrowed, securities sold
under agreements to repurchase, securities loaned and
certain non-collateralized short-term borrowings
The Company elected the fair value option for certain portfolios of fixed-
income securities purchased under agreements to resell and fixed-income
securities sold under agreements to repurchase, securities borrowed, securities
loaned, and certain non-collateralized short-term borrowings held primarily
by broker-dealer entities in the United States, United Kingdom and Japan.
In each case, the election was made because the related interest-rate risk is
managed on a portfolio basis, primarily with derivative instruments that are
accounted for at fair value through earnings.
Changes in fair value for transactions in these portfolios are recorded in
Principal transactions. The related interest revenue and interest expense are
measured based on the contractual rates specified in the transactions and
are reported as interest revenue and expense in the Consolidated Statement
of Income.
Certain loans and other credit products
Citigroup has elected the fair value option for certain originated and
purchased loans, including certain unfunded loan products, such as
guarantees and letters of credit, executed by Citigroup’s lending and trading
businesses. None of these credit products are highly leveraged financing
commitments. Significant groups of transactions include loans and
unfunded loan products that are expected to be either sold or securitized in
the near term, or transactions where the economic risks are hedged with
derivative instruments, such as purchased credit default swaps or total return
swaps where the Company pays the total return on the underlying loans to a
third party. Citigroup has elected the fair value option to mitigate accounting
mismatches in cases where hedge accounting is complex and to achieve
operational simplifications. Fair value was not elected for most lending
transactions across the Company.
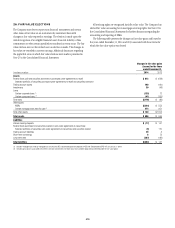
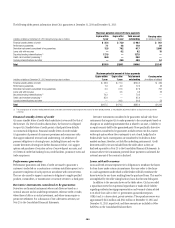
The following table provides information about certain credit products carried at fair value at December 31, 2014 and 2013:
December 31, 2014 December 31, 2013
In millions of dollars Trading assets Loans Trading assets Loans
Carrying amount reported on the Consolidated Balance Sheet $10,290 $5,901 $9,262 $4,105
Aggregate unpaid principal balance in excess of (less than) fair value (26) 125 4 (79)
Balance of non-accrual loans or loans more than 90 days past due 13 3 97 5
Aggregate unpaid principal balance in excess of fair value for non-accrual
loans or loans more than 90 days past due 28 1 41 5
In addition to the amounts reported above, $2,335 million and $2,308
million of unfunded loan commitments related to certain credit products
selected for fair value accounting were outstanding as of December 31, 2014
and 2013, respectively.
Changes in fair value of funded and unfunded credit products are
classified in Principal transactions in the Company’s Consolidated
Statement of Income. Related interest revenue is measured based on the
contractual interest rates and reported as Interest revenue on Trading
account assets or loan interest depending on the balance sheet classifications
of the credit products. The changes in fair value for the years ended
December 31, 2014 and 2013 due to instrument-specific credit risk totaled to
a loss of $155 million and a gain of $4 million, respectively.
Certain investments in unallocated precious metals
Citigroup invests in unallocated precious metals accounts (gold, silver,
platinum and palladium) as part of its commodity and foreign currency
trading activities or to economically hedge certain exposures from issuing
structured liabilities. Under ASC 815, the investment is bifurcated into a debt
host contract and a commodity forward derivative instrument. Citigroup
elects the fair value option for the debt host contract, and reports the debt
host contract within Trading account assets on the Company’s Consolidated
Balance Sheet. The total carrying amount of debt host contracts across
unallocated precious metals accounts was approximately $1.2 billion and
$1.3 billion at December 31, 2014 and 2013, respectively. The amounts are
expected to fluctuate based on trading activity in future periods.
As part of its commodity and foreign currency trading activities, Citi
sells (buys) unallocated precious metals investments and executes forward
purchase (sale) derivative contracts with trading counterparties. When
Citi sells an unallocated precious metals investment, Citi’s receivable from
its depository bank is repaid and Citi derecognizes its investment in the
unallocated precious metal. The forward purchase (sale) contract with the
trading counterparty indexed to unallocated precious metals is accounted
for as a derivative, at fair value through earnings. As of December 31, 2014,
there were approximately $7.2 billion and $6.7 billion notional amounts
of such forward purchase and forward sale derivative contracts
outstanding, respectively.