Citibank 2014 Annual Report Download - page 317
Download and view the complete annual report
Please find page 317 of the 2014 Citibank annual report below. You can navigate through the pages in the report by either clicking on the pages listed below, or by using the keyword search tool below to find specific information within the annual report.-
 1
1 -
2
-
3
-
4
-
5
-
6
-
7
-
8
-
9
-
10
-
11
-
12
-
13
-
14
-
15
-
16
-
17
-
18
-
19
-
20
-
21
-
22
-
23
-
24
-
25
-
26
-
27
-
28
-
29
-
30
-
31
-
32
-
33
-
34
-
35
-
36
-
37
-
38
-
39
-
40
-
41
-
42
-
43
-
44
-
45
-
46
-
47
-
48
-
49
-
50
-
51
-
52
-
53
-
54
-
55
-
56
-
57
-
58
-
59
-
60
-
61
-
62
-
63
-
64
-
65
-
66
-
67
-
68
-
69
-
70
-
71
-
72
-
73
-
74
-
75
-
76
-
77
-
78
-
79
-
80
-
81
-
82
-
83
-
84
-
85
-
86
-
87
-
88
-
89
-
90
-
91
-
92
-
93
-
94
-
95
-
96
-
97
-
98
-
99
-
100
-
101
-
102
-
103
-
104
-
105
-
106
-
107
-
108
-
109
-
110
-
111
-
112
-
113
-
114
-
115
-
116
-
117
-
118
-
119
-
120
-
121
-
122
-
123
-
124
-
125
-
126
-
127
-
128
-
129
-
130
-
131
-
132
-
133
-
134
-
135
-
136
-
137
-
138
-
139
-
140
-
141
-
142
-
143
-
144
-
145
-
146
-
147
-
148
-
149
-
150
-
151
-
152
-
153
-
154
-
155
-
156
-
157
-
158
-
159
-
160
-
161
-
162
-
163
-
164
-
165
-
166
-
167
-
168
-
169
-
170
-
171
-
172
-
173
-
174
-
175
-
176
-
177
-
178
-
179
-
180
-
181
-
182
-
183
-
184
-
185
-
186
-
187
-
188
-
189
-
190
-
191
-
192
-
193
-
194
-
195
-
196
-
197
-
198
-
199
-
200
-
201
-
202
-
203
-
204
-
205
-
206
-
207
-
208
-
209
-
210
-
211
-
212
-
213
-
214
-
215
-
216
-
217
-
218
-
219
-
220
-
221
-
222
-
223
-
224
-
225
-
226
-
227
-
228
-
229
-
230
-
231
-
232
-
233
-
234
-
235
-
236
-
237
-
238
-
239
-
240
-
241
-
242
-
243
-
244
-
245
-
246
-
247
-
248
-
249
-
250
-
251
-
252
-
253
-
254
-
255
-
256
-
257
-
258
-
259
-
260
-
261
-
262
-
263
-
264
-
265
-
266
-
267
-
268
-
269
-
270
-
271
-
272
-
273
-
274
-
275
-
276
-
277
-
278
-
279
-
280
-
281
-
282
-
283
-
284
-
285
-
286
-
287
-
288
-
289
-
290
-
291
-
292
-
293
-
294
-
295
-
296
-
297
-
298
-
299
-
300
-
301
-
302
-
303
-
304
-
305
-
306
-
 307
307 -
 308
308 -
 309
309 -
 310
310 -
 311
311 -
 312
312 -
 313
313 -
 314
314 -
 315
315 -
 316
316 -
 317
317 -
 318
318 -
 319
319 -
 320
320 -
 321
321 -
 322
322 -
 323
323 -
 324
324 -
 325
325 -
 326
326 -
 327
327
 |
 |

300
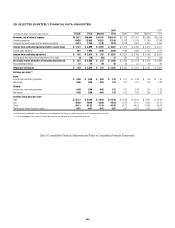
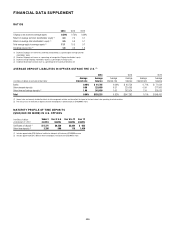
FINANCIAL DATA SUPPLEMENT
RATIOS
2014 2013 2012
Citigroup’s net income to average assets 0.39% 0.73% 0.39%
Return on average common stockholders’ equity (1) 3.4 7.0 4.1
Return on average total stockholders’ equity (2) 3.5 6.9 4.1
Total average equity to average assets (3) 11.1 10.5 9.7
Dividends payout ratio (4) 1.8 0.9 1.6
(1) Based on Citigroup’s net income less preferred stock dividends as a percentage of average common
stockholders’ equity.
(2) Based on Citigroup’s net income as a percentage of average total Citigroup stockholders’ equity.
(3) Based on average Citigroup stockholders’ equity as a percentage of average assets.
(4) Dividends declared per common share as a percentage of net income per diluted share.
AVERAGE DEPOSIT LIABILITIES IN OFFICES OUTSIDE THE U.S. (1)
2014 2013 2012
In millions of dollars at year end except ratios
Average
interest rate
Average
balance
Average
interest rate
Average
balance
Average
interest rate
Average
balance
Banks 0.48% $ 61,705 0.68% $ 63,759 0.71% $ 71,624
Other demand deposits 0.58 229,880 0.57 220,599 0.84 217,806
Other time and savings deposits (2) 1.08 243,630 1.06 262,924 1.24 259,025
Total 0.80% $535,215 0.82% $547,282 1.01% $548,455
(1) Interest rates and amounts include the effects of risk management activities and also reflect the impact of the local interest rates prevailing in certain countries.
(2) Primarily consists of certificates of deposit and other time deposits in denominations of $100,000 or more.
MATURITY PROFILE OF TIME DEPOSITS
($100,000 OR MORE) IN U.S. OFFICES
In millions of dollars
at December 31, 2014
Under 3
months
Over 3 to 6
months
Over 6 to 12
months
Over 12
months
Certificates of deposit (1) $17,271 $6,250 $2,024 $ 655
Other time deposits (2) 3,286 596 115 1,439
(1) Includes approximately $20.5 billion of certificates of deposit with balance of $250,000 or more.
(2) Includes approximately $4.5 billion of other time deposits with balance of $250,000 or more.