Citibank 2014 Annual Report Download - page 38
Download and view the complete annual report
Please find page 38 of the 2014 Citibank annual report below. You can navigate through the pages in the report by either clicking on the pages listed below, or by using the keyword search tool below to find specific information within the annual report.-
 1
1 -
2
-
3
-
4
-
5
-
6
-
7
-
8
-
9
-
10
-
11
-
12
-
13
-
14
-
15
-
16
-
17
-
18
-
19
-
20
-
21
-
22
-
23
-
24
-
25
-
26
-
27
-
 28
28 -
 29
29 -
 30
30 -
 31
31 -
 32
32 -
 33
33 -
 34
34 -
 35
35 -
 36
36 -
 37
37 -
 38
38 -
 39
39 -
 40
40 -
 41
41 -
 42
42 -
 43
43 -
 44
44 -
 45
45 -
 46
46 -
 47
47 -
 48
48 -
49
-
50
-
51
-
52
-
53
-
54
-
55
-
56
-
57
-
58
-
59
-
60
-
61
-
62
-
63
-
64
-
65
-
66
-
67
-
68
-
69
-
70
-
71
-
72
-
73
-
74
-
75
-
76
-
77
-
78
-
79
-
80
-
81
-
82
-
83
-
84
-
85
-
86
-
87
-
88
-
89
-
90
-
91
-
92
-
93
-
94
-
95
-
96
-
97
-
98
-
99
-
100
-
101
-
102
-
103
-
104
-
105
-
106
-
107
-
108
-
109
-
110
-
111
-
112
-
113
-
114
-
115
-
116
-
117
-
118
-
119
-
120
-
121
-
122
-
123
-
124
-
125
-
126
-
127
-
128
-
129
-
130
-
131
-
132
-
133
-
134
-
135
-
136
-
137
-
138
-
139
-
140
-
141
-
142
-
143
-
144
-
145
-
146
-
147
-
148
-
149
-
150
-
151
-
152
-
153
-
154
-
155
-
156
-
157
-
158
-
159
-
160
-
161
-
162
-
163
-
164
-
165
-
166
-
167
-
168
-
169
-
170
-
171
-
172
-
173
-
174
-
175
-
176
-
177
-
178
-
179
-
180
-
181
-
182
-
183
-
184
-
185
-
186
-
187
-
188
-
189
-
190
-
191
-
192
-
193
-
194
-
195
-
196
-
197
-
198
-
199
-
200
-
201
-
202
-
203
-
204
-
205
-
206
-
207
-
208
-
209
-
210
-
211
-
212
-
213
-
214
-
215
-
216
-
217
-
218
-
219
-
220
-
221
-
222
-
223
-
224
-
225
-
226
-
227
-
228
-
229
-
230
-
231
-
232
-
233
-
234
-
235
-
236
-
237
-
238
-
239
-
240
-
241
-
242
-
243
-
244
-
245
-
246
-
247
-
248
-
249
-
250
-
251
-
252
-
253
-
254
-
255
-
256
-
257
-
258
-
259
-
260
-
261
-
262
-
263
-
264
-
265
-
266
-
267
-
268
-
269
-
270
-
271
-
272
-
273
-
274
-
275
-
276
-
277
-
278
-
279
-
280
-
281
-
282
-
283
-
284
-
285
-
286
-
287
-
288
-
289
-
290
-
291
-
292
-
293
-
294
-
295
-
296
-
297
-
298
-
299
-
300
-
301
-
302
-
303
-
304
-
305
-
306
-
307
-
308
-
309
-
310
-
311
-
312
-
313
-
314
-
315
-
316
-
317
-
318
-
319
-
320
-
321
-
322
-
323
-
324
-
325
-
326
-
327
 |
 |
21
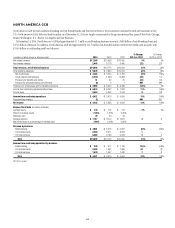
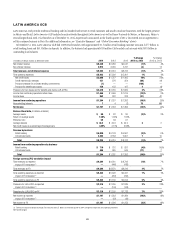
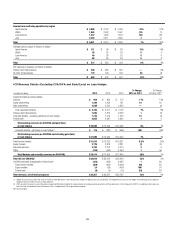
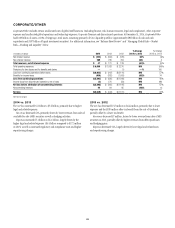
The discussion of the results of operations for Latin America GCB below excludes the impact of FX translation for all periods presented. Presentations
of the results of operations, excluding the impact of FX translation, are non-GAAP financial measures. Citi believes the presentation of Latin America
GCB’s results excluding the impact of FX translation is a more meaningful depiction of the underlying fundamentals of the business. For a
reconciliation of certain of these metrics to the reported results, see the table above.
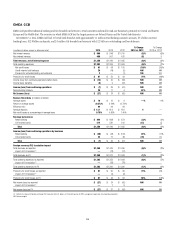
2014 vs. 2013
Net income decreased 3% as higher expenses and credit costs were partially
offset by higher revenues.
Revenues increased 4%, primarily due to volume growth and spread and
fee growth in Mexico, partially offset by continued spread compression in
the region and slower overall economic growth in certain Latin America
markets, including Mexico and Brazil. Net interest revenue increased 4%
due to increased volumes and stable spreads in Mexico, partially offset by the
ongoing spread compression in other Latin America markets. Non-interest
revenue increased 3%, primarily due to higher fees from increased volumes
in retail banking and cards.
Retail banking revenues increased 3% as average loans increased 6%,
investment sales increased 19% and average deposits increased 6%, partially
offset by lower spreads in Brazil and Colombia. Cards revenues increased 6%
as average loans increased 5% and purchase sales increased 1%, excluding
the impact of Credicard’s results in the prior year period (for additional
information, see Note 2 to the Consolidated Financial Statements). The
increase in cards revenues was partially offset by lower economic growth and
slowing cards purchase sales in Mexico due to the previously disclosed fiscal
reforms enacted in 2013 in Mexico, which included, among other things,
higher income and other taxes that negatively impacted consumer behavior
and spending. Citi expects these trends, as well as spread compression, could
continue to negatively impact revenues in Latin America GCB in 2015.
Expenses increased 5%, primarily due to mandatory salary increases in
certain countries, higher legal and related costs, increased repositioning
charges and higher technology spending, partially offset by productivity and
repositioning savings.
Provisions increased 7%, primarily due to higher net credit losses, which
were partially offset by a lower loan loss reserve build. Net credit losses
increased 22%, driven by portfolio growth and continued seasoning in the
Mexico cards portfolio. Net credit losses were also impacted by both the
slower economic growth and fiscal reforms in Mexico (as discussed above)
as well as a $71 million charge-off in the fourth quarter of 2014 related to
Citi’s homebuilder exposure in Mexico, which was offset by a related release
of previously established loan loss reserves and thus neutral to the cost of
credit. The continued impact of the fiscal reforms and economic slowdown
in Mexico is likely to cause net credit losses in Latin America GCB to
remain elevated.
Argentina/Venezuela
For additional information on Citi’s exposures in Argentina and Venezuela
and the potential impact to Latin America GCB results of operations as a
result of certain developments in these countries, see “Managing Global
Risk—Country and Cross-Border Risk” below.
2013 vs. 2012
Net income decreased 9% as higher credit costs, higher expenses and a
higher effective tax rate were partially offset by higher revenues.
Revenues increased 7%, primarily due to volume growth in retail banking
and cards, partially offset by spread compression. Retail banking revenues
increased 5% as average loans increased 12%, investment sales increased 13%
and average deposits increased 2%. Cards revenues increased 10% as average
loans increased 10% and purchase sales increased 12%, excluding the impact
of Credicard’s results.
Expenses increased 3% due to increased volume-related costs, mandatory
salary increases in certain countries and higher regulatory costs, partially
offset by lower repositioning charges and higher repositioning savings.
Provisions increased 25%, primarily due to higher net credit losses as well
as a higher loan loss reserve build. Net credit losses increased 25%, primarily
in the Mexico cards and personal loan portfolios, reflecting both volume
growth and portfolio seasoning. The loan loss reserve build increased 52%,
primarily due to an increase in reserves in Mexico related to the top three
Mexican homebuilders, with the remainder due to portfolio growth and
seasoning and the impact of potential losses related to hurricanes in the
region during September 2013.