Citibank 2014 Annual Report Download - page 206
Download and view the complete annual report
Please find page 206 of the 2014 Citibank annual report below. You can navigate through the pages in the report by either clicking on the pages listed below, or by using the keyword search tool below to find specific information within the annual report.-
 1
1 -
2
-
3
-
4
-
5
-
6
-
7
-
8
-
9
-
10
-
11
-
12
-
13
-
14
-
15
-
16
-
17
-
18
-
19
-
20
-
21
-
22
-
23
-
24
-
25
-
26
-
27
-
28
-
29
-
30
-
31
-
32
-
33
-
34
-
35
-
36
-
37
-
38
-
39
-
40
-
41
-
42
-
43
-
44
-
45
-
46
-
47
-
48
-
49
-
50
-
51
-
52
-
53
-
54
-
55
-
56
-
57
-
58
-
59
-
60
-
61
-
62
-
63
-
64
-
65
-
66
-
67
-
68
-
69
-
70
-
71
-
72
-
73
-
74
-
75
-
76
-
77
-
78
-
79
-
80
-
81
-
82
-
83
-
84
-
85
-
86
-
87
-
88
-
89
-
90
-
91
-
92
-
93
-
94
-
95
-
96
-
97
-
98
-
99
-
100
-
101
-
102
-
103
-
104
-
105
-
106
-
107
-
108
-
109
-
110
-
111
-
112
-
113
-
114
-
115
-
116
-
117
-
118
-
119
-
120
-
121
-
122
-
123
-
124
-
125
-
126
-
127
-
128
-
129
-
130
-
131
-
132
-
133
-
134
-
135
-
136
-
137
-
138
-
139
-
140
-
141
-
142
-
143
-
144
-
145
-
146
-
147
-
148
-
149
-
150
-
151
-
152
-
153
-
154
-
155
-
156
-
157
-
158
-
159
-
160
-
161
-
162
-
163
-
164
-
165
-
166
-
167
-
168
-
169
-
170
-
171
-
172
-
173
-
174
-
175
-
176
-
177
-
178
-
179
-
180
-
181
-
182
-
183
-
184
-
185
-
186
-
187
-
188
-
189
-
190
-
191
-
192
-
193
-
194
-
195
-
 196
196 -
 197
197 -
 198
198 -
 199
199 -
 200
200 -
 201
201 -
 202
202 -
 203
203 -
 204
204 -
 205
205 -
 206
206 -
 207
207 -
 208
208 -
 209
209 -
 210
210 -
 211
211 -
 212
212 -
 213
213 -
 214
214 -
 215
215 -
 216
216 -
217
-
218
-
219
-
220
-
221
-
222
-
223
-
224
-
225
-
226
-
227
-
228
-
229
-
230
-
231
-
232
-
233
-
234
-
235
-
236
-
237
-
238
-
239
-
240
-
241
-
242
-
243
-
244
-
245
-
246
-
247
-
248
-
249
-
250
-
251
-
252
-
253
-
254
-
255
-
256
-
257
-
258
-
259
-
260
-
261
-
262
-
263
-
264
-
265
-
266
-
267
-
268
-
269
-
270
-
271
-
272
-
273
-
274
-
275
-
276
-
277
-
278
-
279
-
280
-
281
-
282
-
283
-
284
-
285
-
286
-
287
-
288
-
289
-
290
-
291
-
292
-
293
-
294
-
295
-
296
-
297
-
298
-
299
-
300
-
301
-
302
-
303
-
304
-
305
-
306
-
307
-
308
-
309
-
310
-
311
-
312
-
313
-
314
-
315
-
316
-
317
-
318
-
319
-
320
-
321
-
322
-
323
-
324
-
325
-
326
-
327
 |
 |

189
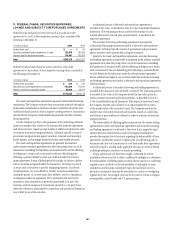
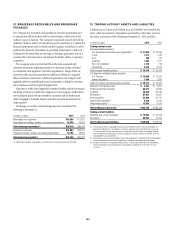
12. BROKERAGE RECEIVABLES AND BROKERAGE
PAYABLES
The Company has receivables and payables for financial instruments sold
to and purchased from brokers, dealers and customers, which arise in the
ordinary course of business. The Company is exposed to risk of loss from the
inability of brokers, dealers or customers to pay for purchases or to deliver the
financial instruments sold, in which case the Company would have to sell or
purchase the financial instruments at prevailing market prices. Credit risk
is reduced to the extent that an exchange or clearing organization acts as a
counterparty to the transaction and replaces the broker, dealer or customer
in question.
The Company seeks to protect itself from the risks associated with
customer activities by requiring customers to maintain margin collateral
in compliance with regulatory and internal guidelines. Margin levels are
monitored daily, and customers deposit additional collateral as required.
Where customers cannot meet collateral requirements, the Company will
liquidate sufficient underlying financial instruments to bring the customer
into compliance with the required margin level.
Exposure to credit risk is impacted by market volatility, which may impair
the ability of clients to satisfy their obligations to the Company. Credit limits
are established and closely monitored for customers and for brokers and
dealers engaged in forwards, futures and other transactions deemed to be
credit sensitive.
Brokerage receivables and Brokerage payables consisted of the
following at December 31:
In millions of dollars 2014 2013
Receivables from customers $10,380 $ 5,811
Receivables from brokers, dealers, and clearing organizations 18,039 19,863
Total brokerage receivables (1) $28,419 $25,674
Payables to customers $33,984 $34,751
Payables to brokers, dealers, and clearing organizations 18,196 18,956
Total brokerage payables (1) $52,180 $53,707
(1) Brokerage receivables and payables are accounted for in accordance with ASC 940-320.
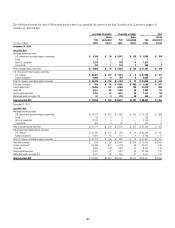
13. TRADING ACCOUNT ASSETS AND LIABILITIES
Trading account assets and Trading account liabilities are carried at fair
value, other than physical commodities accounted for at the lower of cost or
fair value, and consist of the following at December 31, 2014 and 2013:
In millions of dollars 2014 2013
Trading account assets
Mortgage-backed securities (1)
U.S. government-sponsored agency guaranteed $ 27,053 $ 23,955
Prime 1,271 1,422
Alt-A 709 721
Subprime 1,382 1,211
Non-U.S. residential 1,476 723
Commercial 4,343 2,574
Total mortgage-backed securities $ 36,234 $ 30,606
U.S. Treasury and federal agency securities
U.S. Treasury $ 18,906 $ 13,537
Agency obligations 1,568 1,300
Total U.S. Treasury and federal agency securities $ 20,474 $ 14,837
State and municipal securities $ 3,402 $ 3,207
Foreign government securities 66,274 74,856
Corporate 26,460 30,534
Derivatives (2) 67,957 52,821
Equity securities 57,846 61,776
Asset-backed securities (1) 4,546 5,616
Other trading assets (3) 13,593 11,675
Total trading account assets $296,786 $285,928
Trading account liabilities
Securities sold, not yet purchased $ 70,944 $ 61,508
Derivatives (2) 68,092 47,254
Total trading account liabilities $139,036 $108,762
(1) The Company invests in mortgage-backed and asset-backed securities. These securitizations are
generally considered VIEs. The Company’s maximum exposure to loss from these VIEs is equal to
the carrying amount of the securities, which is reflected in the table above. For mortgage-backed
and asset-backed securitizations in which the Company has other involvement, see Note 22 to the
Consolidated Financial Statements.
(2) Presented net, pursuant to enforceable master netting agreements. See Note 23 to the Consolidated
Financial Statements for a discussion regarding the accounting and reporting for derivatives.
(3) Includes investments in unallocated precious metals, as discussed in Note 26 to the Consolidated
Financial Statements. Also includes physical commodities accounted for at the lower of cost or
fair value.