Citibank 2014 Annual Report Download - page 237
Download and view the complete annual report
Please find page 237 of the 2014 Citibank annual report below. You can navigate through the pages in the report by either clicking on the pages listed below, or by using the keyword search tool below to find specific information within the annual report.-
 1
1 -
2
-
3
-
4
-
5
-
6
-
7
-
8
-
9
-
10
-
11
-
12
-
13
-
14
-
15
-
16
-
17
-
18
-
19
-
20
-
21
-
22
-
23
-
24
-
25
-
26
-
27
-
28
-
29
-
30
-
31
-
32
-
33
-
34
-
35
-
36
-
37
-
38
-
39
-
40
-
41
-
42
-
43
-
44
-
45
-
46
-
47
-
48
-
49
-
50
-
51
-
52
-
53
-
54
-
55
-
56
-
57
-
58
-
59
-
60
-
61
-
62
-
63
-
64
-
65
-
66
-
67
-
68
-
69
-
70
-
71
-
72
-
73
-
74
-
75
-
76
-
77
-
78
-
79
-
80
-
81
-
82
-
83
-
84
-
85
-
86
-
87
-
88
-
89
-
90
-
91
-
92
-
93
-
94
-
95
-
96
-
97
-
98
-
99
-
100
-
101
-
102
-
103
-
104
-
105
-
106
-
107
-
108
-
109
-
110
-
111
-
112
-
113
-
114
-
115
-
116
-
117
-
118
-
119
-
120
-
121
-
122
-
123
-
124
-
125
-
126
-
127
-
128
-
129
-
130
-
131
-
132
-
133
-
134
-
135
-
136
-
137
-
138
-
139
-
140
-
141
-
142
-
143
-
144
-
145
-
146
-
147
-
148
-
149
-
150
-
151
-
152
-
153
-
154
-
155
-
156
-
157
-
158
-
159
-
160
-
161
-
162
-
163
-
164
-
165
-
166
-
167
-
168
-
169
-
170
-
171
-
172
-
173
-
174
-
175
-
176
-
177
-
178
-
179
-
180
-
181
-
182
-
183
-
184
-
185
-
186
-
187
-
188
-
189
-
190
-
191
-
192
-
193
-
194
-
195
-
196
-
197
-
198
-
199
-
200
-
201
-
202
-
203
-
204
-
205
-
206
-
207
-
208
-
209
-
210
-
211
-
212
-
213
-
214
-
215
-
216
-
217
-
218
-
219
-
220
-
221
-
222
-
223
-
224
-
225
-
226
-
 227
227 -
 228
228 -
 229
229 -
 230
230 -
 231
231 -
 232
232 -
 233
233 -
 234
234 -
 235
235 -
 236
236 -
 237
237 -
 238
238 -
 239
239 -
 240
240 -
 241
241 -
 242
242 -
 243
243 -
 244
244 -
 245
245 -
 246
246 -
 247
247 -
248
-
249
-
250
-
251
-
252
-
253
-
254
-
255
-
256
-
257
-
258
-
259
-
260
-
261
-
262
-
263
-
264
-
265
-
266
-
267
-
268
-
269
-
270
-
271
-
272
-
273
-
274
-
275
-
276
-
277
-
278
-
279
-
280
-
281
-
282
-
283
-
284
-
285
-
286
-
287
-
288
-
289
-
290
-
291
-
292
-
293
-
294
-
295
-
296
-
297
-
298
-
299
-
300
-
301
-
302
-
303
-
304
-
305
-
306
-
307
-
308
-
309
-
310
-
311
-
312
-
313
-
314
-
315
-
316
-
317
-
318
-
319
-
320
-
321
-
322
-
323
-
324
-
325
-
326
-
327
 |
 |

220
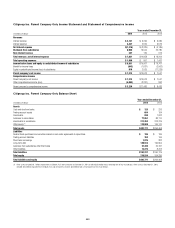
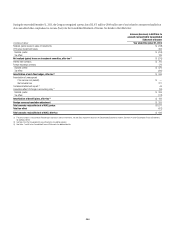
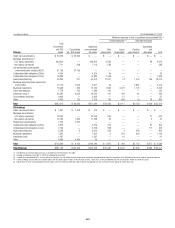
Citigroup Inc. Parent Company Only Income Statement and Statement of Comprehensive Income
Years ended December 31,
In millions of dollars 2014 2013 2012
Revenues
Interest revenue $ 3,121 $ 3,234 $ 3,384
Interest expense 4,437 5,559 6,573
Net interest expense $(1,316) $ (2,325) $ (3,189)
Dividends from subsidiaries 8,900 13,044 20,780
Non-interest revenue 247 139 613
Total revenues, net of interest expense $ 7,831 $10,858 $ 18,204
Total operating expenses $ 1,980 $ 851 $ 1,497
Income before taxes and equity in undistributed income of subsidiaries $ 5,851 $10,007 $ 16,707
Benefit for income taxes (643) (1,637) (2,062)
Equity in undistributed income (loss) of subsidiaries 819 2,029 (11,228)
Parent company’s net income $ 7,313 $ 13,673 $ 7,541
Comprehensive income
Parent company’s net income $ 7,313 $13,673 $ 7,541
Other comprehensive income (loss) (4,083) (2,237) 892
Parent company’s comprehensive income $ 3,230 $11,436 $ 8,433
Citigroup Inc. Parent Company Only Balance Sheet
Years ended December 31,
In millions of dollars 2014 2013
Assets
Cash and due from banks $ 125 $ 233
Trading account assets 604 184
Investments 830 1,032
Advances to subsidiaries 77,951 83,110
Investments in subsidiaries 211,353 203,739
Other assets (1) 110,908 106,170
Total assets $401,771 $394,468
Liabilities
Federal funds purchased and securities loaned or sold under agreements to repurchase $ 185 $ 185
Trading account liabilities 762 165
Short-term borrowings 1,075 382
Long-term debt 149,512 156,804
Advances from subsidiaries other than banks 27,430 24,181
Other liabilities 12,273 8,412
Total liabilities $191,237 $190,129
Total equity 210,534 204,339
Total liabilities and equity $401,771 $394,468
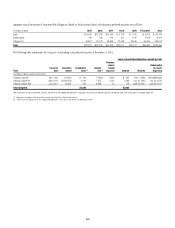
(1) Other assets included $42.7 billion of placements to Citibank, N.A. and its branches at December 31, 2014, of which $33.9 billion had a remaining term of less than 30 days. Other assets at December 31, 2013
included $43.3 billion of placements to Citibank, N.A. and its branches, of which $33.6 billion had a remaining term of less than 30 days.