Citibank 2014 Annual Report Download - page 289
Download and view the complete annual report
Please find page 289 of the 2014 Citibank annual report below. You can navigate through the pages in the report by either clicking on the pages listed below, or by using the keyword search tool below to find specific information within the annual report.-
 1
1 -
2
-
3
-
4
-
5
-
6
-
7
-
8
-
9
-
10
-
11
-
12
-
13
-
14
-
15
-
16
-
17
-
18
-
19
-
20
-
21
-
22
-
23
-
24
-
25
-
26
-
27
-
28
-
29
-
30
-
31
-
32
-
33
-
34
-
35
-
36
-
37
-
38
-
39
-
40
-
41
-
42
-
43
-
44
-
45
-
46
-
47
-
48
-
49
-
50
-
51
-
52
-
53
-
54
-
55
-
56
-
57
-
58
-
59
-
60
-
61
-
62
-
63
-
64
-
65
-
66
-
67
-
68
-
69
-
70
-
71
-
72
-
73
-
74
-
75
-
76
-
77
-
78
-
79
-
80
-
81
-
82
-
83
-
84
-
85
-
86
-
87
-
88
-
89
-
90
-
91
-
92
-
93
-
94
-
95
-
96
-
97
-
98
-
99
-
100
-
101
-
102
-
103
-
104
-
105
-
106
-
107
-
108
-
109
-
110
-
111
-
112
-
113
-
114
-
115
-
116
-
117
-
118
-
119
-
120
-
121
-
122
-
123
-
124
-
125
-
126
-
127
-
128
-
129
-
130
-
131
-
132
-
133
-
134
-
135
-
136
-
137
-
138
-
139
-
140
-
141
-
142
-
143
-
144
-
145
-
146
-
147
-
148
-
149
-
150
-
151
-
152
-
153
-
154
-
155
-
156
-
157
-
158
-
159
-
160
-
161
-
162
-
163
-
164
-
165
-
166
-
167
-
168
-
169
-
170
-
171
-
172
-
173
-
174
-
175
-
176
-
177
-
178
-
179
-
180
-
181
-
182
-
183
-
184
-
185
-
186
-
187
-
188
-
189
-
190
-
191
-
192
-
193
-
194
-
195
-
196
-
197
-
198
-
199
-
200
-
201
-
202
-
203
-
204
-
205
-
206
-
207
-
208
-
209
-
210
-
211
-
212
-
213
-
214
-
215
-
216
-
217
-
218
-
219
-
220
-
221
-
222
-
223
-
224
-
225
-
226
-
227
-
228
-
229
-
230
-
231
-
232
-
233
-
234
-
235
-
236
-
237
-
238
-
239
-
240
-
241
-
242
-
243
-
244
-
245
-
246
-
247
-
248
-
249
-
250
-
251
-
252
-
253
-
254
-
255
-
256
-
257
-
258
-
259
-
260
-
261
-
262
-
263
-
264
-
265
-
266
-
267
-
268
-
269
-
270
-
271
-
272
-
273
-
274
-
275
-
276
-
277
-
278
-
 279
279 -
 280
280 -
 281
281 -
 282
282 -
 283
283 -
 284
284 -
 285
285 -
 286
286 -
 287
287 -
 288
288 -
 289
289 -
 290
290 -
 291
291 -
 292
292 -
 293
293 -
 294
294 -
 295
295 -
 296
296 -
 297
297 -
 298
298 -
 299
299 -
300
-
301
-
302
-
303
-
304
-
305
-
306
-
307
-
308
-
309
-
310
-
311
-
312
-
313
-
314
-
315
-
316
-
317
-
318
-
319
-
320
-
321
-
322
-
323
-
324
-
325
-
326
-
327
 |
 |

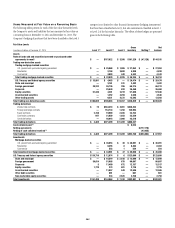
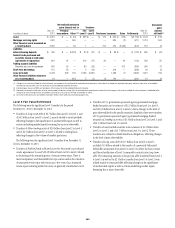
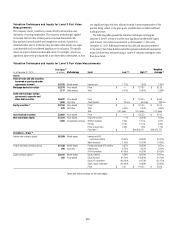
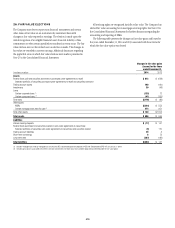
272
As of December 31, 2013
Fair Value
(in millions)
(1)
Methodology Input Low (2)(3) High (2)(3)
Weighted
Average (4)
Assets
Federal funds sold and securities
borrowed or purchased under
agreements to resell $3,299 Model-based Interest rate 1.33% 2.19% 2.04%
Mortgage-backed securities $2,869 Price-based Price $ 0.10 $ 117.78 $ 77.60
1,241 Yield analysis Yield 0.03% 21.80% 8.66%
State and municipal, foreign
government, corporate and
other debt securities $5,361 Price-based Price $ — $ 126.49 $ 87.47
2,014 Cash flow Credit spread 11 bps 375 bps 213 bps
Equity securities (5) $ 947 Price-based Price (5) $ 0.31 $ 93.66 $ 86.90
827 Cash flow Yield 4.00% 5.00% 4.50%
WAL 0.01 years 3.55 years 1.38 years
Asset-backed securities $4,539 Price-based Price $ — $ 135.83 $ 70.89
1,300 Model-based Credit spread 25 bps 378 bps 302 bps
Non-marketable equity $2,324 Price-based Fund NAV (5) $ 612 $336,559,340 $124,080,454
1,470 Comparables analysis EBITDA multiples 4.20x 16.90x 9.78x
533 Cash flow Discount to price —% 75.00% 3.47%
Price-to-book ratio 0.90x 1.05x 1.02x
PE ratio 9.10x 9.10x 9.10x
Derivatives—Gross (6)
Interest rate contracts (gross) $5,721 Model-based Interest rate (IR)
lognormal volatility 10.60% 87.20% 21.16%
Foreign exchange contracts (gross) $1,727 Model-based Foreign exchange (FX) volatility 1.00% 28.00% 13.45%
189 Cash flow Interest rate 0.11% 13.88% 6.02%
IR-FX correlation 40.00% 60.00% 50.00%
IR-IR correlation 40.00% 68.79% 40.52%
Credit spread 25 bps 419 bps 162 bps
Equity contracts (gross) (7) $3,189 Model-based Equity volatility 10.02% 73.48% 29.87%
563 Price-based Equity forward 79.10% 141.00% 100.24%
Equity-equity correlation (81.30)% 99.40% 48.45%
Equity-FX correlation (70.00)% 55.00% 0.60%
Price $ — $ 118.75 $ 88.10
Commodity contracts (gross) $2,988 Model-based Commodity volatility 4.00% 146.00% 15.00%
Commodity correlation (75.00)% 90.00% 32.00%
Forward price 23.00% 242.00% 105.00%
Credit derivatives (gross) $4,767 Model-based Recovery rate 20.00% 64.00% 38.11%
1,520 Price-based Credit correlation 5.00% 95.00% 47.43%
Price $ 0.02 $ 115.20 $ 29.83
Credit spread 3 bps 1,335 bps 203 bps
Upfront points 2.31 100.00 57.69
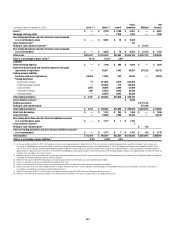
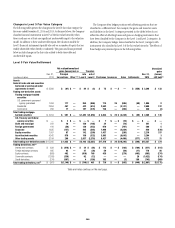
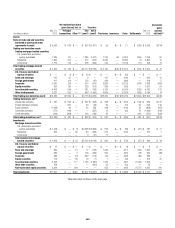
Table and notes continue on the next page.