Citibank 2014 Annual Report Download - page 203
Download and view the complete annual report
Please find page 203 of the 2014 Citibank annual report below. You can navigate through the pages in the report by either clicking on the pages listed below, or by using the keyword search tool below to find specific information within the annual report.-
 1
1 -
2
-
3
-
4
-
5
-
6
-
7
-
8
-
9
-
10
-
11
-
12
-
13
-
14
-
15
-
16
-
17
-
18
-
19
-
20
-
21
-
22
-
23
-
24
-
25
-
26
-
27
-
28
-
29
-
30
-
31
-
32
-
33
-
34
-
35
-
36
-
37
-
38
-
39
-
40
-
41
-
42
-
43
-
44
-
45
-
46
-
47
-
48
-
49
-
50
-
51
-
52
-
53
-
54
-
55
-
56
-
57
-
58
-
59
-
60
-
61
-
62
-
63
-
64
-
65
-
66
-
67
-
68
-
69
-
70
-
71
-
72
-
73
-
74
-
75
-
76
-
77
-
78
-
79
-
80
-
81
-
82
-
83
-
84
-
85
-
86
-
87
-
88
-
89
-
90
-
91
-
92
-
93
-
94
-
95
-
96
-
97
-
98
-
99
-
100
-
101
-
102
-
103
-
104
-
105
-
106
-
107
-
108
-
109
-
110
-
111
-
112
-
113
-
114
-
115
-
116
-
117
-
118
-
119
-
120
-
121
-
122
-
123
-
124
-
125
-
126
-
127
-
128
-
129
-
130
-
131
-
132
-
133
-
134
-
135
-
136
-
137
-
138
-
139
-
140
-
141
-
142
-
143
-
144
-
145
-
146
-
147
-
148
-
149
-
150
-
151
-
152
-
153
-
154
-
155
-
156
-
157
-
158
-
159
-
160
-
161
-
162
-
163
-
164
-
165
-
166
-
167
-
168
-
169
-
170
-
171
-
172
-
173
-
174
-
175
-
176
-
177
-
178
-
179
-
180
-
181
-
182
-
183
-
184
-
185
-
186
-
187
-
188
-
189
-
190
-
191
-
192
-
 193
193 -
 194
194 -
 195
195 -
 196
196 -
 197
197 -
 198
198 -
 199
199 -
 200
200 -
 201
201 -
 202
202 -
 203
203 -
 204
204 -
 205
205 -
 206
206 -
 207
207 -
 208
208 -
 209
209 -
 210
210 -
 211
211 -
 212
212 -
 213
213 -
214
-
215
-
216
-
217
-
218
-
219
-
220
-
221
-
222
-
223
-
224
-
225
-
226
-
227
-
228
-
229
-
230
-
231
-
232
-
233
-
234
-
235
-
236
-
237
-
238
-
239
-
240
-
241
-
242
-
243
-
244
-
245
-
246
-
247
-
248
-
249
-
250
-
251
-
252
-
253
-
254
-
255
-
256
-
257
-
258
-
259
-
260
-
261
-
262
-
263
-
264
-
265
-
266
-
267
-
268
-
269
-
270
-
271
-
272
-
273
-
274
-
275
-
276
-
277
-
278
-
279
-
280
-
281
-
282
-
283
-
284
-
285
-
286
-
287
-
288
-
289
-
290
-
291
-
292
-
293
-
294
-
295
-
296
-
297
-
298
-
299
-
300
-
301
-
302
-
303
-
304
-
305
-
306
-
307
-
308
-
309
-
310
-
311
-
312
-
313
-
314
-
315
-
316
-
317
-
318
-
319
-
320
-
321
-
322
-
323
-
324
-
325
-
326
-
327
 |
 |

186
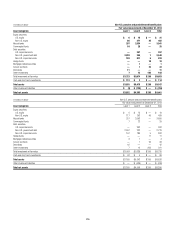
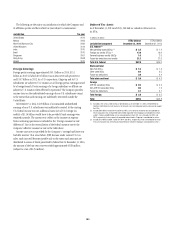
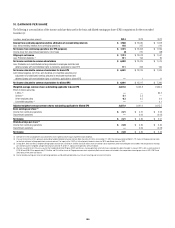
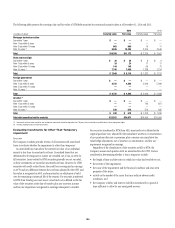
10. EARNINGS PER SHARE
The following is a reconciliation of the income and share data used in the basic and diluted earnings per share (EPS) computations for the years ended
December 31:
In millions, except per-share amounts 2014 2013 2012
Income from continuing operations before attribution of noncontrolling interests $ 7,500 $13,630 $ 7,818
Less: Noncontrolling interests from continuing operations 185 227 219
Net income from continuing operations (for EPS purposes) $ 7,315 $ 13,403 $ 7,599
Income (loss) from discontinued operations, net of taxes (2) 270 (58)
Citigroup’s net income $ 7,313 $ 13,673 $ 7,541
Less: Preferred dividends (1) 511 194 26
Net income available to common shareholders $ 6,802 $ 13,479 $ 7,515
Less: Dividends and undistributed earnings allocated to employee restricted and
deferred shares with nonforfeitable rights to dividends, applicable to basic EPS 111 263 166
Net income allocated to common shareholders for basic EPS $ 6,691 $ 13,216 $ 7,349
Add: Interest expense, net of tax, and dividends on convertible securities and
adjustment of undistributed earnings allocated to employee restricted and
deferred shares with nonforfeitable rights to dividends, applicable to diluted EPS —1 11
Net income allocated to common shareholders for diluted EPS $ 6,691 $ 13,217 $ 7,360
Weighted-average common shares outstanding applicable to basic EPS 3,031.6 3,035.8 2,930.6
Effect of dilutive securities
T-DECs (2) —— 84.2
Options (3) 5.1 5.3 —
Other employee plans 0.3 0.5 0.6
Convertible securities (4) —— 0.1
Adjusted weighted-average common shares outstanding applicable to diluted EPS 3,037.0 3,041.6 3,015.5
Basic earnings per share (5)
Income from continuing operations $ 2.21 $ 4.27 $ 2.53
Discontinued operations —0.09 (0.02)
Net income $ 2.21 $ 4.35 $ 2.51
Diluted earnings per share (5)
Income from continuing operations $ 2.20 $ 4.26 $ 2.46
Discontinued operations —0.09 (0.02)
Net income $ 2.20 $ 4.35 $ 2.44
(1) See Note 21 to the Consolidated Financial Statements for the potential future impact of preferred stock dividends.
(2) Pursuant to the terms of Citi’s previously outstanding Tangible Dividend Enhanced Common Stock Securities (T-DECs), on December 17, 2012, the Company delivered 96,337,772 shares of Citigroup common stock
for the final settlement of the prepaid stock purchase contract. The impact of the T-DECs is fully reflected in the basic shares for 2013 and diluted shares for 2012.
(3) During 2014, 2013 and 2012, weighted-average options to purchase 2.8 million, 4.8 million and 35.8 million shares of common stock, respectively, were outstanding but not included in the computation of earnings
per share because the weighted-average exercise prices of $153.91, $101.11 and $54.23 respectively, were anti-dilutive.
(4) Warrants issued to the U.S. Treasury as part of the Troubled Asset Relief Program (TARP) and the loss-sharing agreement (all of which were subsequently sold to the public in January 2011), with an exercise price of
$178.50 and $106.10 for approximately 21.0 million and 25.5 million shares of Citigroup common stock, respectively. Both warrants were not included in the computation of earnings per share in 2014, 2013 and
2012 because they were anti-dilutive.
(5) Due to rounding, earnings per share on continuing operations and discontinued operations may not sum to earnings per share on net income.