Citibank 2014 Annual Report Download - page 63
Download and view the complete annual report
Please find page 63 of the 2014 Citibank annual report below. You can navigate through the pages in the report by either clicking on the pages listed below, or by using the keyword search tool below to find specific information within the annual report.-
 1
1 -
2
-
3
-
4
-
5
-
6
-
7
-
8
-
9
-
10
-
11
-
12
-
13
-
14
-
15
-
16
-
17
-
18
-
19
-
20
-
21
-
22
-
23
-
24
-
25
-
26
-
27
-
28
-
29
-
30
-
31
-
32
-
33
-
34
-
35
-
36
-
37
-
38
-
39
-
40
-
41
-
42
-
43
-
44
-
45
-
46
-
47
-
48
-
49
-
50
-
51
-
52
-
 53
53 -
 54
54 -
 55
55 -
 56
56 -
 57
57 -
 58
58 -
 59
59 -
 60
60 -
 61
61 -
 62
62 -
 63
63 -
 64
64 -
 65
65 -
 66
66 -
 67
67 -
 68
68 -
 69
69 -
 70
70 -
 71
71 -
 72
72 -
 73
73 -
74
-
75
-
76
-
77
-
78
-
79
-
80
-
81
-
82
-
83
-
84
-
85
-
86
-
87
-
88
-
89
-
90
-
91
-
92
-
93
-
94
-
95
-
96
-
97
-
98
-
99
-
100
-
101
-
102
-
103
-
104
-
105
-
106
-
107
-
108
-
109
-
110
-
111
-
112
-
113
-
114
-
115
-
116
-
117
-
118
-
119
-
120
-
121
-
122
-
123
-
124
-
125
-
126
-
127
-
128
-
129
-
130
-
131
-
132
-
133
-
134
-
135
-
136
-
137
-
138
-
139
-
140
-
141
-
142
-
143
-
144
-
145
-
146
-
147
-
148
-
149
-
150
-
151
-
152
-
153
-
154
-
155
-
156
-
157
-
158
-
159
-
160
-
161
-
162
-
163
-
164
-
165
-
166
-
167
-
168
-
169
-
170
-
171
-
172
-
173
-
174
-
175
-
176
-
177
-
178
-
179
-
180
-
181
-
182
-
183
-
184
-
185
-
186
-
187
-
188
-
189
-
190
-
191
-
192
-
193
-
194
-
195
-
196
-
197
-
198
-
199
-
200
-
201
-
202
-
203
-
204
-
205
-
206
-
207
-
208
-
209
-
210
-
211
-
212
-
213
-
214
-
215
-
216
-
217
-
218
-
219
-
220
-
221
-
222
-
223
-
224
-
225
-
226
-
227
-
228
-
229
-
230
-
231
-
232
-
233
-
234
-
235
-
236
-
237
-
238
-
239
-
240
-
241
-
242
-
243
-
244
-
245
-
246
-
247
-
248
-
249
-
250
-
251
-
252
-
253
-
254
-
255
-
256
-
257
-
258
-
259
-
260
-
261
-
262
-
263
-
264
-
265
-
266
-
267
-
268
-
269
-
270
-
271
-
272
-
273
-
274
-
275
-
276
-
277
-
278
-
279
-
280
-
281
-
282
-
283
-
284
-
285
-
286
-
287
-
288
-
289
-
290
-
291
-
292
-
293
-
294
-
295
-
296
-
297
-
298
-
299
-
300
-
301
-
302
-
303
-
304
-
305
-
306
-
307
-
308
-
309
-
310
-
311
-
312
-
313
-
314
-
315
-
316
-
317
-
318
-
319
-
320
-
321
-
322
-
323
-
324
-
325
-
326
-
327
 |
 |

46
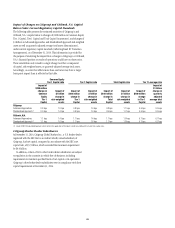
Basel III (Full Implementation)
Citigroup’s Capital Resources Under Basel III
(Full Implementation)
Citi currently anticipates that its effective minimum Common Equity Tier 1
Capital, Tier 1 Capital and Total Capital ratio requirements under the Final
Basel III Rules, on a fully implemented basis, will be at least 9%, 10.5% and
12.5%, respectively. However, Citi’s effective minimum ratio requirements
will be higher if the Federal Reserve Board’s GSIB surcharge rule were to be
adopted as proposed.
Further, under the Final Basel III Rules, Citi must also comply with a 4%
minimum Tier 1 Leverage ratio requirement and an effective 5% minimum
Supplementary Leverage ratio requirement.
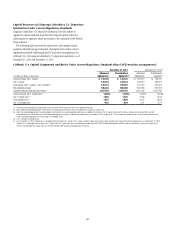
The following table sets forth the capital tiers, risk-weighted assets,
quarterly adjusted average total assets and capital ratios under the Final
Basel III Rules for Citi, assuming full implementation, as of December 31,
2014 and December 31, 2013.
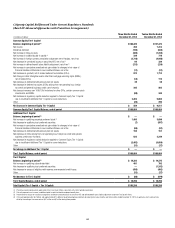
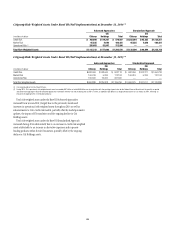
Citigroup Capital Components and Ratios Under Basel III (Full Implementation)
December 31, 2014 December 31, 2013
In millions of dollars, except ratios
Advanced
Approaches
Standardized
Approach (1)
Advanced
Approaches
Standardized
Approach (1)
Common Equity Tier 1 Capital $ 136,806 $ 136,806 $ 125,597 $ 125,597
Tier 1 Capital 148,275 148,275 133,412 133,412
Total Capital (Tier 1 Capital + Tier 2 Capital) (2) 165,663 178,625 150,049 161,782
Risk-Weighted Assets 1,292,878 1,228,748 1,185,766 1,176,886
Quarterly Adjusted Average Total Assets (3) 1,835,497 1,835,497 1,814,368 1,814,368
Common Equity Tier 1 Capital ratio (4)(5) 10.58% 11.13% 10.59% 10.67%
Tier 1 Capital ratio (4)(5) 11.47 12.07 11.25 11.34
Total Capital ratio (4)(5) 12.81 14.54 12.65 13.75
Tier 1 Leverage ratio (5) 8.08 8.08 7.35 7.35
(1) Common Equity Tier 1 Capital, Tier 1 Capital, and Total Capital ratios as well as related components reflect application of the Basel III Standardized Approach framework effective January 1, 2015.
(2) Under the Advanced Approaches framework eligible credit reserves that exceed expected credit losses are eligible for inclusion in Tier 2 Capital to the extent the excess reserves do not exceed 0.6% of credit
risk-weighted assets, which differs from the Standardized Approach in which the allowance for credit losses is includable in Tier 2 Capital up to 1.25% of credit risk-weighted assets, with any excess allowance for
credit losses being deducted in arriving at credit risk-weighted assets.
(3) Tier 1 Leverage ratio denominator.
(4) As of December 31, 2014 and December 31, 2013, Citi’s Common Equity Tier 1 Capital, Tier 1 Capital, and Total Capital ratios were the lower derived under the Basel III Advanced Approaches framework.
(5) Citi’s Basel III capital ratios and certain related components are non-GAAP financial measures. Citi believes these ratios and their related components provide useful information to investors and others by measuring
Citi’s progress against future regulatory capital standards.
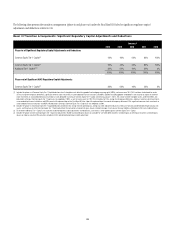
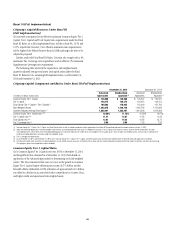
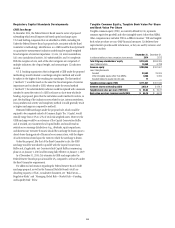
Common Equity Tier 1 Capital Ratio
Citi’s Common Equity Tier 1 Capital ratio was 10.6% at December 31, 2014,
unchanged from that estimated as of December 31, 2013 (both based on
application of the Advanced Approaches for determining total risk-weighted
assets). The ratio remained stable year-over-year as the growth in Common
Equity Tier 1 Capital largely reflecting net income of $7.3 billion and the
favorable effects attributable to DTA utilization of approximately $3.3 billion,
was offset by a decline in Accumulated other comprehensive income (loss),
and higher credit and operational risk-weighted assets.