Citibank 2014 Annual Report Download - page 266
Download and view the complete annual report
Please find page 266 of the 2014 Citibank annual report below. You can navigate through the pages in the report by either clicking on the pages listed below, or by using the keyword search tool below to find specific information within the annual report.-
 1
1 -
2
-
3
-
4
-
5
-
6
-
7
-
8
-
9
-
10
-
11
-
12
-
13
-
14
-
15
-
16
-
17
-
18
-
19
-
20
-
21
-
22
-
23
-
24
-
25
-
26
-
27
-
28
-
29
-
30
-
31
-
32
-
33
-
34
-
35
-
36
-
37
-
38
-
39
-
40
-
41
-
42
-
43
-
44
-
45
-
46
-
47
-
48
-
49
-
50
-
51
-
52
-
53
-
54
-
55
-
56
-
57
-
58
-
59
-
60
-
61
-
62
-
63
-
64
-
65
-
66
-
67
-
68
-
69
-
70
-
71
-
72
-
73
-
74
-
75
-
76
-
77
-
78
-
79
-
80
-
81
-
82
-
83
-
84
-
85
-
86
-
87
-
88
-
89
-
90
-
91
-
92
-
93
-
94
-
95
-
96
-
97
-
98
-
99
-
100
-
101
-
102
-
103
-
104
-
105
-
106
-
107
-
108
-
109
-
110
-
111
-
112
-
113
-
114
-
115
-
116
-
117
-
118
-
119
-
120
-
121
-
122
-
123
-
124
-
125
-
126
-
127
-
128
-
129
-
130
-
131
-
132
-
133
-
134
-
135
-
136
-
137
-
138
-
139
-
140
-
141
-
142
-
143
-
144
-
145
-
146
-
147
-
148
-
149
-
150
-
151
-
152
-
153
-
154
-
155
-
156
-
157
-
158
-
159
-
160
-
161
-
162
-
163
-
164
-
165
-
166
-
167
-
168
-
169
-
170
-
171
-
172
-
173
-
174
-
175
-
176
-
177
-
178
-
179
-
180
-
181
-
182
-
183
-
184
-
185
-
186
-
187
-
188
-
189
-
190
-
191
-
192
-
193
-
194
-
195
-
196
-
197
-
198
-
199
-
200
-
201
-
202
-
203
-
204
-
205
-
206
-
207
-
208
-
209
-
210
-
211
-
212
-
213
-
214
-
215
-
216
-
217
-
218
-
219
-
220
-
221
-
222
-
223
-
224
-
225
-
226
-
227
-
228
-
229
-
230
-
231
-
232
-
233
-
234
-
235
-
236
-
237
-
238
-
239
-
240
-
241
-
242
-
243
-
244
-
245
-
246
-
247
-
248
-
249
-
250
-
251
-
252
-
253
-
254
-
255
-
 256
256 -
 257
257 -
 258
258 -
 259
259 -
 260
260 -
 261
261 -
 262
262 -
 263
263 -
 264
264 -
 265
265 -
 266
266 -
 267
267 -
 268
268 -
 269
269 -
 270
270 -
 271
271 -
 272
272 -
 273
273 -
 274
274 -
 275
275 -
 276
276 -
277
-
278
-
279
-
280
-
281
-
282
-
283
-
284
-
285
-
286
-
287
-
288
-
289
-
290
-
291
-
292
-
293
-
294
-
295
-
296
-
297
-
298
-
299
-
300
-
301
-
302
-
303
-
304
-
305
-
306
-
307
-
308
-
309
-
310
-
311
-
312
-
313
-
314
-
315
-
316
-
317
-
318
-
319
-
320
-
321
-
322
-
323
-
324
-
325
-
326
-
327
 |
 |
249
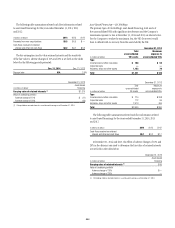
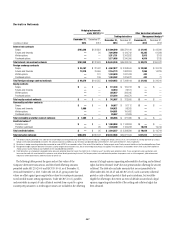
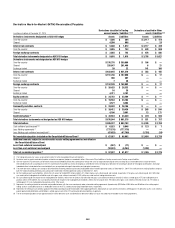
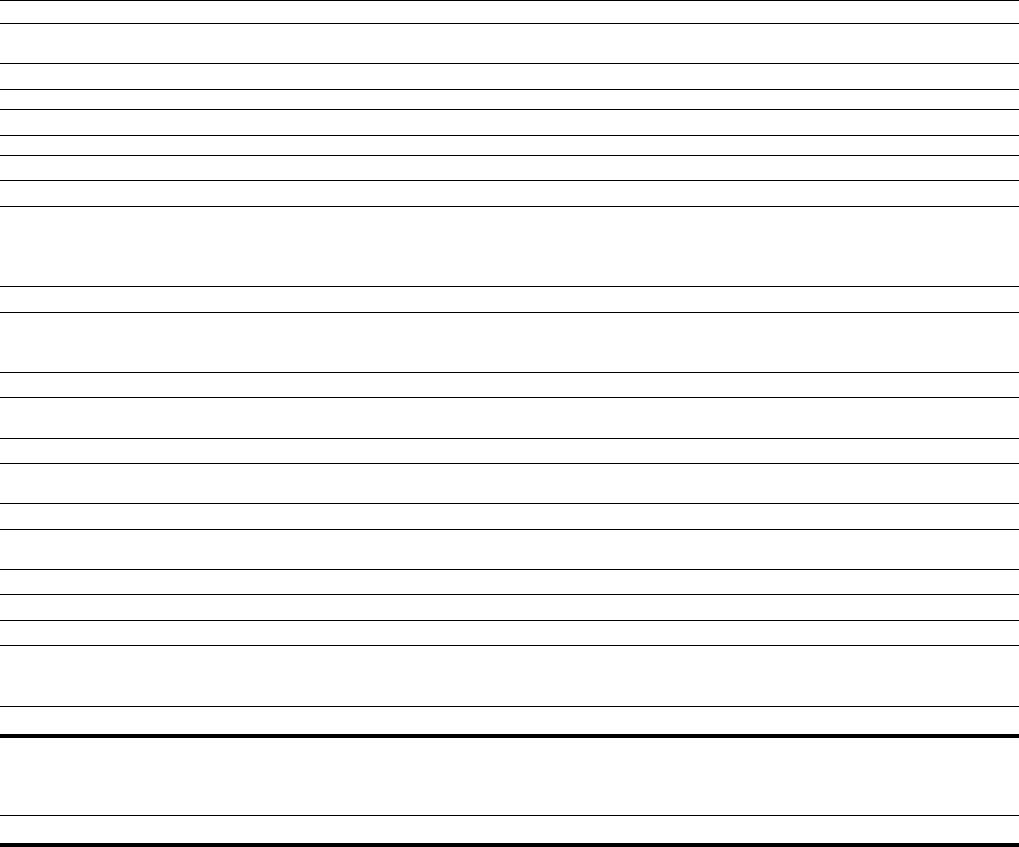
In millions of dollars at December 31, 2013
Derivatives classified in Trading
account assets / liabilities (1)(2)(3)
Derivatives classified in Other
assets / liabilities (2)(3)
Derivatives instruments designated as ASC 815 hedges Assets Liabilities Assets Liabilities
Over-the-counter $ 956 $ 306 $ 3,082 $ 854
Cleared 2,505 585 5 —
Interest rate contracts $ 3,461 $ 891 $ 3,087 $ 854
Over-the-counter $ 1,540 $ 1,244 $ 989 $ 293
Foreign exchange contracts $ 1,540 $ 1,244 $ 989 $ 293
Over-the-counter $ — $ — $ — $ 2
Credit derivatives $ — $ — $ — $ 2
Total derivative instruments designated as ASC 815 hedges $ 5,001 $ 2,135 $ 4,076 $1,149
Derivatives instruments not designated as ASC 815 hedges
Over-the-counter $ 313,772 $ 297,115 $ 37 $ 9
Cleared 311,114 319,190 27 5
Exchange traded 33 30 — —
Interest rate contracts $ 624,919 $ 616,335 $ 64 $ 14
Over-the-counter $ 89,847 $ 86,147 $ 79 $ 3
Cleared 1,119 1,191 — —
Exchange traded 48 55 — —
Foreign exchange contracts $ 91,014 $ 87,393 $ 79 $ 3
Over-the-counter $ 19,080 $ 28,458 $ — $ —
Exchange traded 5,797 5,834 — —
Equity contracts $ 24,877 $ 34,292 $ — $ —
Over-the-counter $ 7,921 $ 9,059 $ — $ —
Exchange traded 1,161 1,111 — —
Commodity and other contracts $ 9,082 $ 10,170 $ — $ —
Over-the-counter $ 38,496 $ 38,247 $ 71 $ 563
Cleared 1,850 2,547 — —
Credit derivatives (4) $ 40,346 $ 40,794 $ 71 $ 563
Total Derivatives instruments not designated as ASC 815 hedges $ 790,238 $ 788,984 $ 214 $ 580
Total derivatives $ 795,239 $ 791,119 $ 4,290 $1,729
Cash collateral paid/received (5)(6) $ 6,073 $ 8,827 $ 82 $ 282
Less: Netting agreements (7) (713,598 ) (713,598) — —
Less: Netting cash collateral received/paid (8) (34,893 ) (39,094) (2,951 ) —
Net receivables/payables included on the Consolidated Balance Sheet (9) $ 52,821 $ 47,254 $ 1,421 $2,011
Additional amounts subject to an enforceable master netting agreement
but not offset on the Consolidated Balance Sheet
Less: Cash collateral received/paid $ (365 ) $ (5) $ — $ —
Less: Non-cash collateral received/paid (7,478 ) (3,345) (341 ) —
Total net receivables/payables (9) $ 44,978 $ 43,904 $ 1,080 $2,011
(1) The trading derivatives fair values are presented in Note 13 to the Consolidated Financial Statements.
(2) Derivative mark-to-market receivables/payables related to management hedges are recorded in either Other assets/Other liabilities or Trading account assets/Trading account liabilities.
(3) Over-the-counter (OTC) derivatives include derivatives executed and settled bilaterally with counterparties without the use of an organized exchange or central clearing house. Cleared derivatives include derivatives
executed bilaterally with a counterparty in the OTC market but then novated to a central clearing house, whereby the central clearing house becomes the counterparty to both of the original counterparties. Exchange
traded derivatives include derivatives executed directly on an organized exchange that provides pre-trade price transparency.
(4) The credit derivatives trading assets comprise $13,673 million related to protection purchased and $26,673 million related to protection sold as of December 31, 2013. The credit derivatives trading liabilities comprise
$28,158 million related to protection purchased and $12,636 million related to protection sold as of December 31, 2013.
(5) For the trading account assets/liabilities, reflects the net amount of the $45,167 million and $43,720 million of gross cash collateral paid and received, respectively. Of the gross cash collateral paid, $39,094 million
was used to offset derivative liabilities and, of the gross cash collateral received, $34,893 million was used to offset derivative assets.
(6) For cash collateral received with respect to non-trading derivative liabilities, reflects the net amount of $3,233 million of gross cash collateral received of which $2,951 million is netted against non-trading derivative
positions within other assets.
(7) Represents the netting of derivative receivable and payable balances with the same counterparty under enforceable netting agreements. Approximately $392 billion, $317 billion and $5 billion of the netting against
trading account asset/liability balances is attributable to each of the OTC, cleared and exchange-traded derivatives, respectively.
(8) Represents the netting of cash collateral paid and received by counterparty under enforceable credit support agreements. Substantially all cash collateral received is netted against OTC derivative assets. Cash collateral
paid of approximately $33 billion and $6 billion is netted against OTC and cleared derivative liabilities, respectively.
(9) The net receivables/payables include approximately $16 billion of both derivative asset and liability fair values not subject to enforceable master netting agreements.