Citibank 2014 Annual Report Download - page 108
Download and view the complete annual report
Please find page 108 of the 2014 Citibank annual report below. You can navigate through the pages in the report by either clicking on the pages listed below, or by using the keyword search tool below to find specific information within the annual report.-
 1
1 -
2
-
3
-
4
-
5
-
6
-
7
-
8
-
9
-
10
-
11
-
12
-
13
-
14
-
15
-
16
-
17
-
18
-
19
-
20
-
21
-
22
-
23
-
24
-
25
-
26
-
27
-
28
-
29
-
30
-
31
-
32
-
33
-
34
-
35
-
36
-
37
-
38
-
39
-
40
-
41
-
42
-
43
-
44
-
45
-
46
-
47
-
48
-
49
-
50
-
51
-
52
-
53
-
54
-
55
-
56
-
57
-
58
-
59
-
60
-
61
-
62
-
63
-
64
-
65
-
66
-
67
-
68
-
69
-
70
-
71
-
72
-
73
-
74
-
75
-
76
-
77
-
78
-
79
-
80
-
81
-
82
-
83
-
84
-
85
-
86
-
87
-
88
-
89
-
90
-
91
-
92
-
93
-
94
-
95
-
96
-
97
-
 98
98 -
 99
99 -
 100
100 -
 101
101 -
 102
102 -
 103
103 -
 104
104 -
 105
105 -
 106
106 -
 107
107 -
 108
108 -
 109
109 -
 110
110 -
 111
111 -
 112
112 -
 113
113 -
 114
114 -
 115
115 -
 116
116 -
 117
117 -
 118
118 -
119
-
120
-
121
-
122
-
123
-
124
-
125
-
126
-
127
-
128
-
129
-
130
-
131
-
132
-
133
-
134
-
135
-
136
-
137
-
138
-
139
-
140
-
141
-
142
-
143
-
144
-
145
-
146
-
147
-
148
-
149
-
150
-
151
-
152
-
153
-
154
-
155
-
156
-
157
-
158
-
159
-
160
-
161
-
162
-
163
-
164
-
165
-
166
-
167
-
168
-
169
-
170
-
171
-
172
-
173
-
174
-
175
-
176
-
177
-
178
-
179
-
180
-
181
-
182
-
183
-
184
-
185
-
186
-
187
-
188
-
189
-
190
-
191
-
192
-
193
-
194
-
195
-
196
-
197
-
198
-
199
-
200
-
201
-
202
-
203
-
204
-
205
-
206
-
207
-
208
-
209
-
210
-
211
-
212
-
213
-
214
-
215
-
216
-
217
-
218
-
219
-
220
-
221
-
222
-
223
-
224
-
225
-
226
-
227
-
228
-
229
-
230
-
231
-
232
-
233
-
234
-
235
-
236
-
237
-
238
-
239
-
240
-
241
-
242
-
243
-
244
-
245
-
246
-
247
-
248
-
249
-
250
-
251
-
252
-
253
-
254
-
255
-
256
-
257
-
258
-
259
-
260
-
261
-
262
-
263
-
264
-
265
-
266
-
267
-
268
-
269
-
270
-
271
-
272
-
273
-
274
-
275
-
276
-
277
-
278
-
279
-
280
-
281
-
282
-
283
-
284
-
285
-
286
-
287
-
288
-
289
-
290
-
291
-
292
-
293
-
294
-
295
-
296
-
297
-
298
-
299
-
300
-
301
-
302
-
303
-
304
-
305
-
306
-
307
-
308
-
309
-
310
-
311
-
312
-
313
-
314
-
315
-
316
-
317
-
318
-
319
-
320
-
321
-
322
-
323
-
324
-
325
-
326
-
327
 |
 |

91
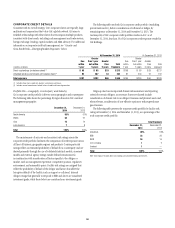
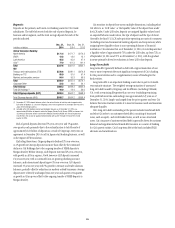
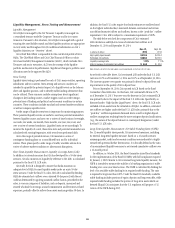
Citi’s corporate credit portfolio is also diversified by industry. The following
table shows the allocation of Citi’s total corporate credit portfolio by industry:
Total Exposure
December 31,
2014
December 31,
2013
Transportation and industrial 21% 22%
Consumer retail and health 17 15
Power, chemicals, commodities and
metals and mining 10 10
Energy (1) 10 10
Technology, media and telecom 910
Banks/broker-dealers 810
Real estate 65
Public sector 56
Insurance and special purpose entities 55
Hedge funds 54
Other industries 43
Total 100% 100%
Note: Total exposure includes direct outstandings and unfunded lending commitments.
(1) In addition to this exposure, Citi also has energy-related exposure within the “Public sector”
(e.g., energy-related state-owned entities) and “Transportation and industrial” sector (e.g., off-shore
drilling entities) included in the table above. As of December 31, 2014, Citi’s total exposure to these
energy-related entities was approximately $7 billion, of which approximately $4 billion consisted of
direct outstanding funded loans.
There has recently been a focus on the energy sector, given the decline
in oil prices during the latter part of 2014. As of December 31, 2014, Citi’s
total corporate credit exposure to the energy and energy-related sector
(see footnote 1 to the table above) was approximately $60 billion, with
approximately $22 billion, or 3%, of Citi’s total outstanding loans consisting
of direct outstanding funded loans. In addition, as of December 31, 2014,
approximately 70% of Citi’s total corporate credit energy and energy-related
exposure (based on the methodology described above) was in the United
States, United Kingdom and Canada. Also as of year-end 2014, approximately
85% of Citi’s total energy and energy-related exposures were rated
investment grade.
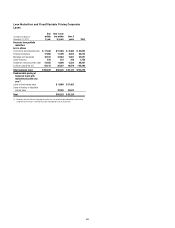
Credit Risk Mitigation
As part of its overall risk management activities, Citigroup uses credit
derivatives and other risk mitigants to hedge portions of the credit risk in
its corporate credit portfolio, in addition to outright asset sales. The results
of the mark-to-market and any realized gains or losses on credit derivatives
are reflected in Principal transactions on the Consolidated Statement
of Income.
At December 31, 2014 and December 31, 2013, $27.6 billion and
$27.2 billion, respectively, of the corporate credit portfolio was economically
hedged. Citigroup’s expected loss model used in the calculation of its loan
loss reserve does not include the favorable impact of credit derivatives
and other mitigants that are marked-to-market. In addition, the reported
amounts of direct outstandings and unfunded lending commitments in
the tables above do not reflect the impact of these hedging transactions.
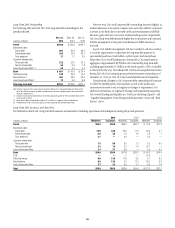
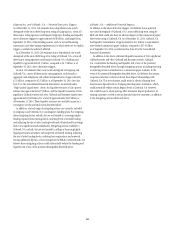
At December 31, 2014 and December 31, 2013, the credit protection was
economically hedging underlying corporate credit portfolio exposures with
the following risk rating distribution:
Rating of Hedged Exposure
December 31,
2014
December 31,
2013
AAA/AA/A 24% 26%
BBB 42 36
BB/B 28 29
CCC or below 69
Total 100% 100%
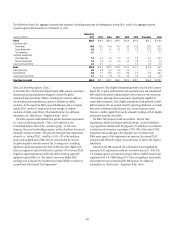
At December 31, 2014 and December 31, 2013, the credit protection was
economically hedging underlying corporate credit portfolio exposures with
the following industry distribution:
Industry of Hedged Exposure
December 31,
2014
December 31,
2013
Transportation and industrial 30% 31%
Power, chemicals, commodities and metals
and mining 15 15
Technology, media and telecom 15 14
Consumer retail and health 11 9
Energy 10 8
Banks/broker-dealers 78
Public Sector 66
Insurance and special purpose entities 47
Other industries 22
Total 100% 100%
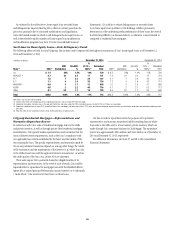
For additional information on Citi’s corporate credit portfolio, including
allowance for loan losses, coverage ratios and corporate non-accrual loans,
see “Credit Risk—Loans Outstanding, Details of Credit Loss Experience,
Allowance for Loan Losses and Non-Accrual Loans and Assets” above.