Citibank 2014 Annual Report Download - page 175
Download and view the complete annual report
Please find page 175 of the 2014 Citibank annual report below. You can navigate through the pages in the report by either clicking on the pages listed below, or by using the keyword search tool below to find specific information within the annual report.-
 1
1 -
2
-
3
-
4
-
5
-
6
-
7
-
8
-
9
-
10
-
11
-
12
-
13
-
14
-
15
-
16
-
17
-
18
-
19
-
20
-
21
-
22
-
23
-
24
-
25
-
26
-
27
-
28
-
29
-
30
-
31
-
32
-
33
-
34
-
35
-
36
-
37
-
38
-
39
-
40
-
41
-
42
-
43
-
44
-
45
-
46
-
47
-
48
-
49
-
50
-
51
-
52
-
53
-
54
-
55
-
56
-
57
-
58
-
59
-
60
-
61
-
62
-
63
-
64
-
65
-
66
-
67
-
68
-
69
-
70
-
71
-
72
-
73
-
74
-
75
-
76
-
77
-
78
-
79
-
80
-
81
-
82
-
83
-
84
-
85
-
86
-
87
-
88
-
89
-
90
-
91
-
92
-
93
-
94
-
95
-
96
-
97
-
98
-
99
-
100
-
101
-
102
-
103
-
104
-
105
-
106
-
107
-
108
-
109
-
110
-
111
-
112
-
113
-
114
-
115
-
116
-
117
-
118
-
119
-
120
-
121
-
122
-
123
-
124
-
125
-
126
-
127
-
128
-
129
-
130
-
131
-
132
-
133
-
134
-
135
-
136
-
137
-
138
-
139
-
140
-
141
-
142
-
143
-
144
-
145
-
146
-
147
-
148
-
149
-
150
-
151
-
152
-
153
-
154
-
155
-
156
-
157
-
158
-
159
-
160
-
161
-
162
-
163
-
164
-
 165
165 -
 166
166 -
 167
167 -
 168
168 -
 169
169 -
 170
170 -
 171
171 -
 172
172 -
 173
173 -
 174
174 -
 175
175 -
 176
176 -
 177
177 -
 178
178 -
 179
179 -
 180
180 -
 181
181 -
 182
182 -
 183
183 -
 184
184 -
 185
185 -
186
-
187
-
188
-
189
-
190
-
191
-
192
-
193
-
194
-
195
-
196
-
197
-
198
-
199
-
200
-
201
-
202
-
203
-
204
-
205
-
206
-
207
-
208
-
209
-
210
-
211
-
212
-
213
-
214
-
215
-
216
-
217
-
218
-
219
-
220
-
221
-
222
-
223
-
224
-
225
-
226
-
227
-
228
-
229
-
230
-
231
-
232
-
233
-
234
-
235
-
236
-
237
-
238
-
239
-
240
-
241
-
242
-
243
-
244
-
245
-
246
-
247
-
248
-
249
-
250
-
251
-
252
-
253
-
254
-
255
-
256
-
257
-
258
-
259
-
260
-
261
-
262
-
263
-
264
-
265
-
266
-
267
-
268
-
269
-
270
-
271
-
272
-
273
-
274
-
275
-
276
-
277
-
278
-
279
-
280
-
281
-
282
-
283
-
284
-
285
-
286
-
287
-
288
-
289
-
290
-
291
-
292
-
293
-
294
-
295
-
296
-
297
-
298
-
299
-
300
-
301
-
302
-
303
-
304
-
305
-
306
-
307
-
308
-
309
-
310
-
311
-
312
-
313
-
314
-
315
-
316
-
317
-
318
-
319
-
320
-
321
-
322
-
323
-
324
-
325
-
326
-
327
 |
 |

158
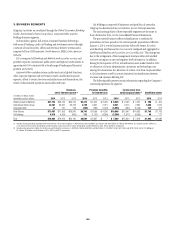
3. BUSINESS SEGMENTS
Citigroup’s activities are conducted through the Global Consumer Banking
(GCB), Institutional Clients Group (ICG), Corporate/Other and Citi
Holdings business segments.
GCB includes a global, full-service consumer franchise delivering a
wide array of banking, credit card lending and investment services through
a network of local branches, offices and electronic delivery systems and is
composed of four GCB businesses: North America, EMEA, Latin America
and Asia.
ICG is composed of Banking and Markets and securities services and
provides corporate, institutional, public sector and high-net-worth clients in
approximately 100 countries with a broad range of banking and financial
products and services.
Corporate/Other includes certain unallocated costs of global functions,
other corporate expenses and net treasury results, unallocated corporate
expenses, offsets to certain line-item reclassifications and eliminations, the
results of discontinued operations and unallocated taxes.
Citi Holdings is composed of businesses and portfolios of assets that
Citigroup has determined are not central to its core Citicorp businesses.
The accounting policies of these reportable segments are the same as
those disclosed in Note 1 to the Consolidated Financial Statements.
The prior-period balances reflect reclassifications to conform the
presentation in those periods to the current period’s presentation. Effective
January 1, 2014, certain business activities within the former Securities
and Banking and Transaction Services were realigned and aggregated as
Banking and Markets and securities services within ICG. This change was
due to the realignment of the management structure within ICG and did
not have an impact on any total segment-level information. In addition,
during the first quarter of 2014, reclassifications were made related to Citi’s
re-allocation of certain administrative, operations and technology costs
among Citi’s businesses, the allocation of certain costs from Corporate/Other
to Citi’s businesses as well as certain immaterial reclassifications between
revenues and expenses affecting ICG.
The following table presents certain information regarding the Company’s
continuing operations by segment:
Revenues,
net of interest expense (1)
Provision (benefits)
for income taxes
Income (loss) from
continuing operations (2) Identifiable assets
In millions of dollars, except
identifiable assets in billions 2014 2013 2012 2014 2013 2012 2014 2013 2012 2014 2013
Global Consumer Banking $37,753 $38,165 $39,105 $3,473 $ 3,424 $ 3,468 $ 6,938 $ 6,763 $ 7,597 $ 396 $ 405
Institutional Clients Group 33,267 33,567 30,762 3,729 3,857 2,021 9,521 9,414 7,834 1,020 1,045
Corporate/Other 47 121 128 (459) (282) (1,093) (5,593) (630) (1,048) 329 313
Total Citicorp $71,067 $71,853 $69,995 $6,743 $ 6,999 $ 4,396 $10,866 $15,547 $14,383 $1,745 $1,763
Citi Holdings 5,815 4,566 (805) 121 (1,132) (4,389) (3,366) (1,917) (6,565) 98 117
Total $76,882 $76,419 $69,190 $6,864 $ 5,867 $ 7 $ 7,500 $13,630 $ 7,818 $1,843 $1,880
(1) Includes Citicorp (excluding Corporate/Other) total revenues, net of interest expense, in North America of $32.0 billion, $31.2 billion and $29.9 billion; in EMEA of $10.9 billion, $11.5 billion and $11.5 billion; in
Latin America of $13.4 billion, $14.0 billion and $13.5 billion; and in Asia of $14.7 billion, $15.0 billion and $15.0 billion in 2014, 2013, and 2012, respectively.
(2) Includes pretax provisions (credits) for credit losses and for benefits and claims in GCB of $6.1 billion, $6.8 billion and $6.2 billion; in ICG of $57 million, $78 million and $276 million; and in Citi Holdings of
$1.3 billion, $1.6 billion and $4.9 billion in 2014, 2013, and 2012, respectively.