Citibank 2014 Annual Report Download - page 59
Download and view the complete annual report
Please find page 59 of the 2014 Citibank annual report below. You can navigate through the pages in the report by either clicking on the pages listed below, or by using the keyword search tool below to find specific information within the annual report.-
 1
1 -
2
-
3
-
4
-
5
-
6
-
7
-
8
-
9
-
10
-
11
-
12
-
13
-
14
-
15
-
16
-
17
-
18
-
19
-
20
-
21
-
22
-
23
-
24
-
25
-
26
-
27
-
28
-
29
-
30
-
31
-
32
-
33
-
34
-
35
-
36
-
37
-
38
-
39
-
40
-
41
-
42
-
43
-
44
-
45
-
46
-
47
-
48
-
 49
49 -
 50
50 -
 51
51 -
 52
52 -
 53
53 -
 54
54 -
 55
55 -
 56
56 -
 57
57 -
 58
58 -
 59
59 -
 60
60 -
 61
61 -
 62
62 -
 63
63 -
 64
64 -
 65
65 -
 66
66 -
 67
67 -
 68
68 -
 69
69 -
70
-
71
-
72
-
73
-
74
-
75
-
76
-
77
-
78
-
79
-
80
-
81
-
82
-
83
-
84
-
85
-
86
-
87
-
88
-
89
-
90
-
91
-
92
-
93
-
94
-
95
-
96
-
97
-
98
-
99
-
100
-
101
-
102
-
103
-
104
-
105
-
106
-
107
-
108
-
109
-
110
-
111
-
112
-
113
-
114
-
115
-
116
-
117
-
118
-
119
-
120
-
121
-
122
-
123
-
124
-
125
-
126
-
127
-
128
-
129
-
130
-
131
-
132
-
133
-
134
-
135
-
136
-
137
-
138
-
139
-
140
-
141
-
142
-
143
-
144
-
145
-
146
-
147
-
148
-
149
-
150
-
151
-
152
-
153
-
154
-
155
-
156
-
157
-
158
-
159
-
160
-
161
-
162
-
163
-
164
-
165
-
166
-
167
-
168
-
169
-
170
-
171
-
172
-
173
-
174
-
175
-
176
-
177
-
178
-
179
-
180
-
181
-
182
-
183
-
184
-
185
-
186
-
187
-
188
-
189
-
190
-
191
-
192
-
193
-
194
-
195
-
196
-
197
-
198
-
199
-
200
-
201
-
202
-
203
-
204
-
205
-
206
-
207
-
208
-
209
-
210
-
211
-
212
-
213
-
214
-
215
-
216
-
217
-
218
-
219
-
220
-
221
-
222
-
223
-
224
-
225
-
226
-
227
-
228
-
229
-
230
-
231
-
232
-
233
-
234
-
235
-
236
-
237
-
238
-
239
-
240
-
241
-
242
-
243
-
244
-
245
-
246
-
247
-
248
-
249
-
250
-
251
-
252
-
253
-
254
-
255
-
256
-
257
-
258
-
259
-
260
-
261
-
262
-
263
-
264
-
265
-
266
-
267
-
268
-
269
-
270
-
271
-
272
-
273
-
274
-
275
-
276
-
277
-
278
-
279
-
280
-
281
-
282
-
283
-
284
-
285
-
286
-
287
-
288
-
289
-
290
-
291
-
292
-
293
-
294
-
295
-
296
-
297
-
298
-
299
-
300
-
301
-
302
-
303
-
304
-
305
-
306
-
307
-
308
-
309
-
310
-
311
-
312
-
313
-
314
-
315
-
316
-
317
-
318
-
319
-
320
-
321
-
322
-
323
-
324
-
325
-
326
-
327
 |
 |

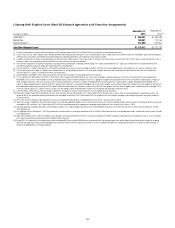
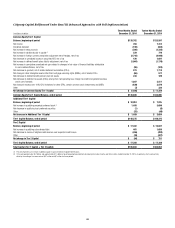
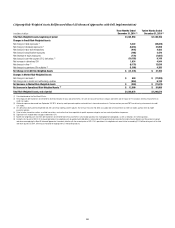
42
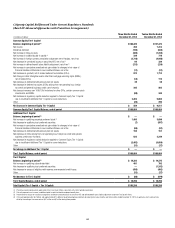
Citigroup Capital Rollforward Under Current Regulatory Standards
(Basel III Advanced Approaches with Transition Arrangements)
In millions of dollars
Three Months Ended
December 31, 2014
Twelve Months Ended
December 31, 2014
Common Equity Tier 1 Capital
Balance, beginning of period (1) $166,425 $157,473
Net income 350 7,313
Dividends declared (190) (633)
Net increase in treasury stock (380) (1,232)
Net increase in additional paid-in capital (2) 229 778
Net increase in foreign currency translation adjustment net of hedges, net of tax (2,716) (4,946)
Net decrease in unrealized losses on securities AFS, net of tax (3) 94 339
Net increase in defined benefit plans liability adjustment, net of tax (3) (213) (234)
Net increase in cumulative unrealized net gain related to changes in fair value of
financial liabilities attributable to own creditworthiness, net of tax (17) (21)
Net decrease in goodwill, net of related deferred tax liabilities (DTLs) 873 1,713
Net change in other intangible assets other than mortgage servicing rights (MSRs),
net of related DTLs (14) 115
Net decrease in defined benefit pension plan net assets 49 38
Net decrease in deferred tax assets (DTAs) arising from net operating loss, foreign
tax credit and general business credit carry-forwards 205 562
Net change in excess over 10%/15% limitations for other DTAs, certain common stock
investments and MSRs (88) 340
Net decrease in regulatory capital deduction applied to Common Equity Tier 1 Capital
due to insufficient Additional Tier 1 Capital to cover deductions 2,402 5,084
Other (25) 295
Net increase in Common Equity Tier 1 Capital $ 559 $ 9,511
Common Equity Tier 1 Capital Balance, end of period $166,984 $166,984
Additional Tier 1 Capital
Balance, beginning of period (1) $ — $ —
Net increase in qualifying perpetual preferred stock (4) 1,493 3,699
Net decrease in qualifying trust preferred securities (7) (897)
Net increase in cumulative unrealized net gain related to changes in fair value of
financial liabilities attributable to own creditworthiness, net of tax (69) (81)
Net decrease in defined benefit pension plan net assets 194 151
Net decrease in DTAs arising from net operating loss, foreign tax credit and general
business credit carry-forwards 822 2,249
Net decrease in regulatory capital deduction applied to Common Equity Tier 1 Capital
due to insufficient Additional Tier 1 Capital to cover deductions (2,402) (5,084)
Other (31) (37)
Net change in Additional Tier 1 Capital $ — $ —
Tier 1 Capital Balance, end of period $166,984 $166,984
Tier 2 Capital
Balance, beginning of period (1) $ 18,382 $ 19,275
Net increase in qualifying subordinated debt 401 792
Net decrease in qualifying trust preferred securities — (1,242)
Net decrease in excess of eligible credit reserves over expected credit losses (456) (492)
Other (31) (37)
Net decrease in Tier 2 Capital $ (86) $ (979)
Tier 2 Capital Balance, end of period $ 18,296 $ 18,296
Total Capital (Tier 1 Capital + Tier 2 Capital) $185,280 $185,280
(1) Pro forma presentation based on application of the Final Basel III Rules consistent with current period presentation.
(2) Primarily represents an increase in additional paid-in capital related to employee benefit plans.
(3) Presented net of impact of transition arrangements related to unrealized losses on securities AFS and defined benefit plans liability adjustment under the Final Basel III Rules.
(4) Citi issued approximately $3.7 billion and approximately $1.5 billion of qualifying perpetual preferred stock during the twelve months and three months ended December 31, 2014, respectively, which were partially
offset by the netting of issuance costs of $31 million and $7 million during those periods.