Citibank 2014 Annual Report Download - page 269
Download and view the complete annual report
Please find page 269 of the 2014 Citibank annual report below. You can navigate through the pages in the report by either clicking on the pages listed below, or by using the keyword search tool below to find specific information within the annual report.-
 1
1 -
2
-
3
-
4
-
5
-
6
-
7
-
8
-
9
-
10
-
11
-
12
-
13
-
14
-
15
-
16
-
17
-
18
-
19
-
20
-
21
-
22
-
23
-
24
-
25
-
26
-
27
-
28
-
29
-
30
-
31
-
32
-
33
-
34
-
35
-
36
-
37
-
38
-
39
-
40
-
41
-
42
-
43
-
44
-
45
-
46
-
47
-
48
-
49
-
50
-
51
-
52
-
53
-
54
-
55
-
56
-
57
-
58
-
59
-
60
-
61
-
62
-
63
-
64
-
65
-
66
-
67
-
68
-
69
-
70
-
71
-
72
-
73
-
74
-
75
-
76
-
77
-
78
-
79
-
80
-
81
-
82
-
83
-
84
-
85
-
86
-
87
-
88
-
89
-
90
-
91
-
92
-
93
-
94
-
95
-
96
-
97
-
98
-
99
-
100
-
101
-
102
-
103
-
104
-
105
-
106
-
107
-
108
-
109
-
110
-
111
-
112
-
113
-
114
-
115
-
116
-
117
-
118
-
119
-
120
-
121
-
122
-
123
-
124
-
125
-
126
-
127
-
128
-
129
-
130
-
131
-
132
-
133
-
134
-
135
-
136
-
137
-
138
-
139
-
140
-
141
-
142
-
143
-
144
-
145
-
146
-
147
-
148
-
149
-
150
-
151
-
152
-
153
-
154
-
155
-
156
-
157
-
158
-
159
-
160
-
161
-
162
-
163
-
164
-
165
-
166
-
167
-
168
-
169
-
170
-
171
-
172
-
173
-
174
-
175
-
176
-
177
-
178
-
179
-
180
-
181
-
182
-
183
-
184
-
185
-
186
-
187
-
188
-
189
-
190
-
191
-
192
-
193
-
194
-
195
-
196
-
197
-
198
-
199
-
200
-
201
-
202
-
203
-
204
-
205
-
206
-
207
-
208
-
209
-
210
-
211
-
212
-
213
-
214
-
215
-
216
-
217
-
218
-
219
-
220
-
221
-
222
-
223
-
224
-
225
-
226
-
227
-
228
-
229
-
230
-
231
-
232
-
233
-
234
-
235
-
236
-
237
-
238
-
239
-
240
-
241
-
242
-
243
-
244
-
245
-
246
-
247
-
248
-
249
-
250
-
251
-
252
-
253
-
254
-
255
-
256
-
257
-
258
-
 259
259 -
 260
260 -
 261
261 -
 262
262 -
 263
263 -
 264
264 -
 265
265 -
 266
266 -
 267
267 -
 268
268 -
 269
269 -
 270
270 -
 271
271 -
 272
272 -
 273
273 -
 274
274 -
 275
275 -
 276
276 -
 277
277 -
 278
278 -
 279
279 -
280
-
281
-
282
-
283
-
284
-
285
-
286
-
287
-
288
-
289
-
290
-
291
-
292
-
293
-
294
-
295
-
296
-
297
-
298
-
299
-
300
-
301
-
302
-
303
-
304
-
305
-
306
-
307
-
308
-
309
-
310
-
311
-
312
-
313
-
314
-
315
-
316
-
317
-
318
-
319
-
320
-
321
-
322
-
323
-
324
-
325
-
326
-
327
 |
 |

252
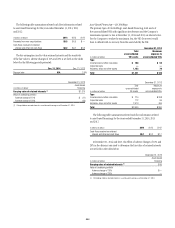
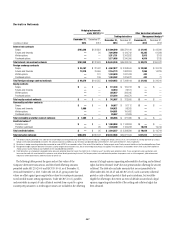
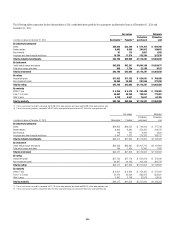
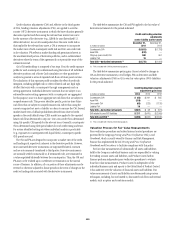
The following table summarizes the gains (losses) on the Company’s fair value hedges for the years ended December 31, 2014 and 2013 and 2012:
Gains (losses) on fair value hedges
Year ended December 31,
(1)
In millions of dollars 2014 2013 2012
Gain (loss) on the derivatives in designated and qualifying fair value hedges
Interest rate contracts $ 1,546 $(3,288) $ 122
Foreign exchange contracts 1,367 265 377
Commodity contracts (221) — —
Total gain (loss) on the derivatives in designated and qualifying fair value hedges $ 2,692 $(3,023) $ 499
Gain (loss) on the hedged item in designated and qualifying fair value hedges
Interest rate hedges $(1,496) $ 3,204 $(371)
Foreign exchange hedges (1,422) (185) (331)
Commodity hedges 250 — —
Total gain (loss) on the hedged item in designated and qualifying fair value hedges $(2,668) $ 3,019 $(702)
Hedge ineffectiveness recognized in earnings on designated and qualifying fair value hedges
Interest rate hedges $ 53 $ (84) $(249)
Foreign exchange hedges (16) (4) 16
Total hedge ineffectiveness recognized in earnings on designated and qualifying fair value hedges $ 37 $ (88) $(233)
Net gain (loss) excluded from assessment of the effectiveness of fair value hedges
Interest rate contracts $ (3) $ — $ —
Foreign exchange contracts (2) (39) 84 30
Commodity hedges (2) 29 — —
Total net gain (loss) excluded from assessment of the effectiveness of fair value hedges $ (13) $ 84 $ 30
(1) Amounts are included in Other revenue on the Consolidated Statement of Income. The accrued interest income on fair value hedges is recorded in Net interest revenue and is excluded from this table.
(2) Amounts relate to the premium associated with forward contracts (differential between spot and contractual forward rates). These amounts are excluded from the assessment of hedge effectiveness and are reflected
directly in earnings.
Cash Flow Hedges
Hedging of benchmark interest rate risk
Citigroup hedges variable cash flows associated with floating-rate liabilities
and the rollover (re-issuance) of liabilities. Variable cash flows from those
liabilities are converted to fixed-rate cash flows by entering into receive-
variable, pay-fixed interest rate swaps and receive-variable, pay-fixed
forward-starting interest rate swaps. Citi also hedges variable cash flows from
recognized and forecasted floating-rate assets. Variable cash flows from those
assets are converted to fixed-rate cash flows by entering into receive-fixed,
pay-variable interest rate swaps. These cash-flow hedging relationships use
either regression analysis or dollar-offset ratio analysis to assess whether
the hedging relationships are highly effective at inception and on an
ongoing basis. When certain variable interest rates, associated with hedged
items, do not qualify as benchmark interest rates, Citigroup designates the
risk being hedged as the risk of overall changes in the hedged cash flows.
Since efforts are made to match the terms of the derivatives to those of the
hedged forecasted cash flows as closely as possible, the amount of hedge
ineffectiveness is not significant.
Hedging of foreign exchange risk
Citigroup locks in the functional currency equivalent cash flows of long-
term debt and short-term borrowings that are denominated in currencies
other than the functional currency of the issuing entity. Depending on the
risk management objectives, these types of hedges are designated as either
cash flow hedges of only foreign exchange risk or cash flow hedges of both
foreign exchange and interest rate risk, and the hedging instruments used
are foreign exchange cross-currency swaps and forward contracts. These
cash flow hedge relationships use dollar-offset ratio analysis to determine
whether the hedging relationships are highly effective at inception and on an
ongoing basis.
Hedging of overall changes in cash flows
Citigroup makes purchases of certain “to-be-announced” (TBA) mortgage-
backed securities that meet the definition of a derivative (i.e. a forward
securities purchase). Citigroup commonly designates these derivatives as
hedges of the overall cash flow variability related to the forecasted acquisition
of the TBA mortgage-backed securities. Since the hedged transaction is the
gross settlement of the forward contract, hedge effectiveness is assessed by
assuring that the terms of the hedging instrument and the hedged forecasted
transaction are the same and that delivery of the securities remains probable.