Citibank 2014 Annual Report Download - page 279
Download and view the complete annual report
Please find page 279 of the 2014 Citibank annual report below. You can navigate through the pages in the report by either clicking on the pages listed below, or by using the keyword search tool below to find specific information within the annual report.-
 1
1 -
2
-
3
-
4
-
5
-
6
-
7
-
8
-
9
-
10
-
11
-
12
-
13
-
14
-
15
-
16
-
17
-
18
-
19
-
20
-
21
-
22
-
23
-
24
-
25
-
26
-
27
-
28
-
29
-
30
-
31
-
32
-
33
-
34
-
35
-
36
-
37
-
38
-
39
-
40
-
41
-
42
-
43
-
44
-
45
-
46
-
47
-
48
-
49
-
50
-
51
-
52
-
53
-
54
-
55
-
56
-
57
-
58
-
59
-
60
-
61
-
62
-
63
-
64
-
65
-
66
-
67
-
68
-
69
-
70
-
71
-
72
-
73
-
74
-
75
-
76
-
77
-
78
-
79
-
80
-
81
-
82
-
83
-
84
-
85
-
86
-
87
-
88
-
89
-
90
-
91
-
92
-
93
-
94
-
95
-
96
-
97
-
98
-
99
-
100
-
101
-
102
-
103
-
104
-
105
-
106
-
107
-
108
-
109
-
110
-
111
-
112
-
113
-
114
-
115
-
116
-
117
-
118
-
119
-
120
-
121
-
122
-
123
-
124
-
125
-
126
-
127
-
128
-
129
-
130
-
131
-
132
-
133
-
134
-
135
-
136
-
137
-
138
-
139
-
140
-
141
-
142
-
143
-
144
-
145
-
146
-
147
-
148
-
149
-
150
-
151
-
152
-
153
-
154
-
155
-
156
-
157
-
158
-
159
-
160
-
161
-
162
-
163
-
164
-
165
-
166
-
167
-
168
-
169
-
170
-
171
-
172
-
173
-
174
-
175
-
176
-
177
-
178
-
179
-
180
-
181
-
182
-
183
-
184
-
185
-
186
-
187
-
188
-
189
-
190
-
191
-
192
-
193
-
194
-
195
-
196
-
197
-
198
-
199
-
200
-
201
-
202
-
203
-
204
-
205
-
206
-
207
-
208
-
209
-
210
-
211
-
212
-
213
-
214
-
215
-
216
-
217
-
218
-
219
-
220
-
221
-
222
-
223
-
224
-
225
-
226
-
227
-
228
-
229
-
230
-
231
-
232
-
233
-
234
-
235
-
236
-
237
-
238
-
239
-
240
-
241
-
242
-
243
-
244
-
245
-
246
-
247
-
248
-
249
-
250
-
251
-
252
-
253
-
254
-
255
-
256
-
257
-
258
-
259
-
260
-
261
-
262
-
263
-
264
-
265
-
266
-
267
-
268
-
 269
269 -
 270
270 -
 271
271 -
 272
272 -
 273
273 -
 274
274 -
 275
275 -
 276
276 -
 277
277 -
 278
278 -
 279
279 -
 280
280 -
 281
281 -
 282
282 -
 283
283 -
 284
284 -
 285
285 -
 286
286 -
 287
287 -
 288
288 -
 289
289 -
290
-
291
-
292
-
293
-
294
-
295
-
296
-
297
-
298
-
299
-
300
-
301
-
302
-
303
-
304
-
305
-
306
-
307
-
308
-
309
-
310
-
311
-
312
-
313
-
314
-
315
-
316
-
317
-
318
-
319
-
320
-
321
-
322
-
323
-
324
-
325
-
326
-
327
 |
 |

262
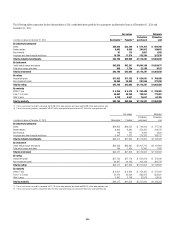
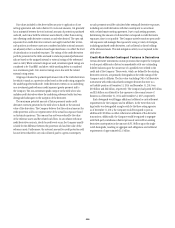
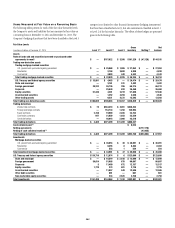
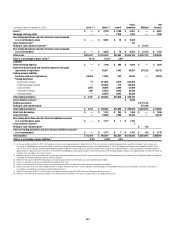
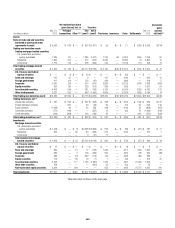
Items Measured at Fair Value on a Recurring Basis
The following tables present for each of the fair value hierarchy levels
the Company’s assets and liabilities that are measured at fair value on
a recurring basis at December 31, 2014 and December 31, 2013. The
Company’shedgingofpositionsthathavebeenclassifiedintheLevel3
category is not limited to other financial instruments (hedging instruments)
thathavebeenclassifiedasLevel3,butalsoinstrumentsclassifiedasLevel1
orLevel2ofthefairvaluehierarchy.Theeffectsofthesehedgesarepresented
gross in the following table.
Fair Value Levels
In millions of dollars at December 31, 2014 Level 1 (1) Level 2 (1) Level 3
Gross
inventory Netting (2)
Net
balance
Assets
Federal funds sold and securities borrowed or purchased under
agreements to resell $ — $187,922 $ 3,398 $191,320 $ (47,129) $144,191
Trading non-derivative assets
Trading mortgage-backed securities
U.S. government-sponsored agency guaranteed $ — $ 25,968 $ 1,085 $ 27,053 $ — $ 27,053
Residential — 2,158 2,680 4,838 — 4,838
Commercial — 3,903 440 4,343 — 4,343
Total trading mortgage-backed securities $ — $ 32,029 $ 4,205 $ 36,234 $ — $ 36,234
U.S. Treasury and federal agency securities $ 15,991 $ 4,483 $ — $ 20,474 $ — $ 20,474
State and municipal — 3,161 241 3,402 — 3,402
Foreign government 39,332 26,736 206 66,274 — 66,274
Corporate — 25,640 820 26,460 — 26,460
Equity securities 51,346 4,281 2,219 57,846 — 57,846
Asset-backed securities — 1,252 3,294 4,546 — 4,546
Other trading assets — 9,221 4,372 13,593 — 13,593
Total trading non-derivative assets $106,669 $106,803 $15,357 $228,829 $ — $228,829
Trading derivatives
Interest rate contracts $ 74 $634,318 $ 4,061 $638,453
Foreign exchange contracts — 154,744 1,250 155,994
Equity contracts 2,748 19,969 2,035 24,752
Commodity contracts 647 21,850 1,023 23,520
Credit derivatives — 40,618 2,900 43,518
Total trading derivatives $ 3,469 $871,499 $11,269 $886,237
Cash collateral paid (3) $ 6,523
Netting agreements $(777,178)
Netting of cash collateral received (7) (47,625)
Total trading derivatives $ 3,469 $871,499 $11,269 $892,760 $(824,803) $ 67,957
Investments
Mortgage-backed securities
U.S. government-sponsored agency guaranteed $ — $ 36,053 $ 38 $ 36,091 $ — $ 36,091
Residential — 8,355 8 8,363 — 8,363
Commercial — 553 1 554 — 554
Total investment mortgage-backed securities $ — $ 44,961 $ 47 $ 45,008 $ — $ 45,008
U.S. Treasury and federal agency securities $110,710 $ 12,974 $ 6 $123,690 $ — $123,690
State and municipal $ — $ 10,519 $ 2,180 $ 12,699 $ — $ 12,699
Foreign government 39,014 51,005 678 90,697 — 90,697
Corporate 5 11,480 672 12,157 — 12,157
Equity securities 1,770 274 681 2,725 — 2,725
Asset-backed securities — 11,957 549 12,506 — 12,506
Other debt securities — 661 — 661 — 661
Non-marketable equity securities — 233 2,525 2,758 — 2,758
Total investments $151,499 $144,064 $ 7,338 $302,901 $ — $302,901